In the last decades, multiple methods were developed in an effort to break the classical imaging resolution by Ernst Abbe. Early techniques overcome the optical resolution limit by encoding spatial information into the other degrees of freedom. While such techniques increase the effective numerical aperture, they are still limited by the diffraction. Modern super-resolution approaches employ non-linear labels. Recently, a linear optics approach, which does not require switchable state fluorophores, but is not limited by the aperture size, was developed. This approach employs subwavelength nanoparticles undergoing Brownian motion next to the object, to passively scan the sample. The method, being based on passive scanning, suffers from long measurement times and other significant limitations; for example, only nanoparticles located closer than the illumination wavelength to the sample contribute to the signal.
We present and experimentally achieve super-resolution by active scanning of the sample with optically-trapped nanoparticles. Our method, where the optical tweezing is for the first time employed to break the diffraction limit, overcomes the outlined limitations of the passive scanning [1]. As the first proof of concept we successfully resolved features down to 100 nm, well-beyond the Abbe-limit.
In our setup, see Fig. 1, a confocal microscope is combined with holographic optical tweezers (HOT), which trap individual 100 nm size nanoparticles and move them across the sample. The HOT is capable to control multiple beams in parallel, in three dimensions. Furthermore, the scan geometry is adjustable in real time, to best fit the dimensions and the size of the object at hand. With such a scanning, the particle-sample distances are smaller than the optical wavelength, and the acquisition time for the present super-resolution method is considerably reduced. Thus, the beam damage to the sensitive samples is minimized. HOT systems are widely used in parallel with optical microscopy for particle manipulation, so that our super-resolution technique does not necessarily require a construction of a specialized new setup, making it affordable and widely applicable.
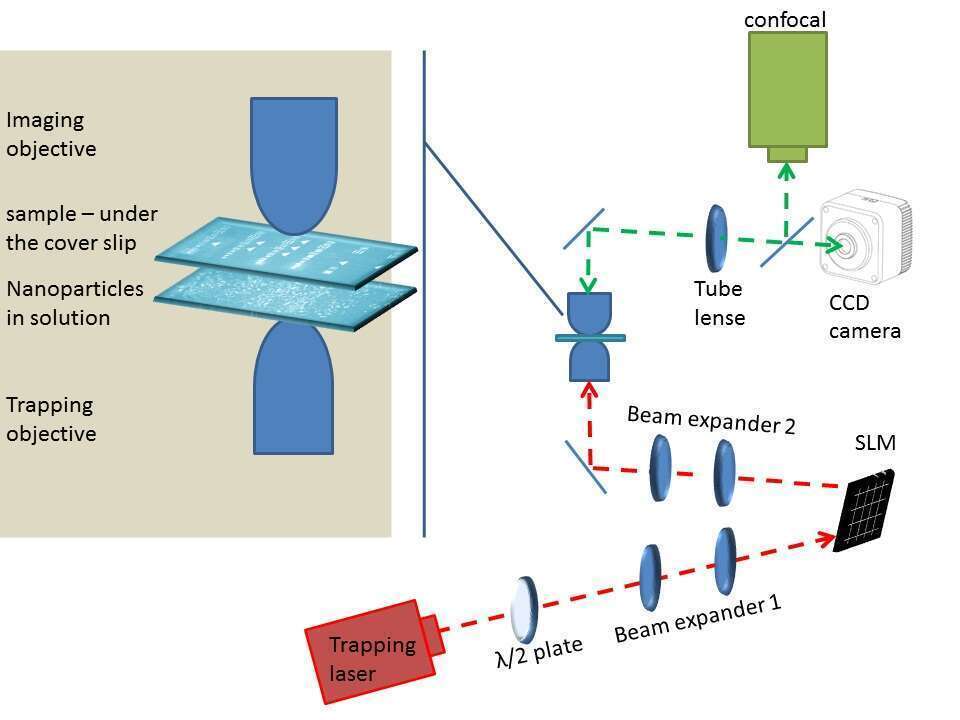
Fig. 1. Experimental system. Imaging is done from the upper side using a confocal microscope. OT is done from below using a1064 nm laser, an SLM and an inverted objective.
Two types of samples were used to test the setup. In the first type of samples, gold nanolines were formed on fused silica cover slips by e-beam lithography. The samples consisted of horizontal and vertical lines with varying line widths between 100 and 250 nm, and varying spaces, 80 to 480 nm. Fig.2 presents an atomic force microscopy (AFM) scan of a typical sample of this type. The second type of samples is randomly deposited nanowires, 6 mm long and 50 nm wide.
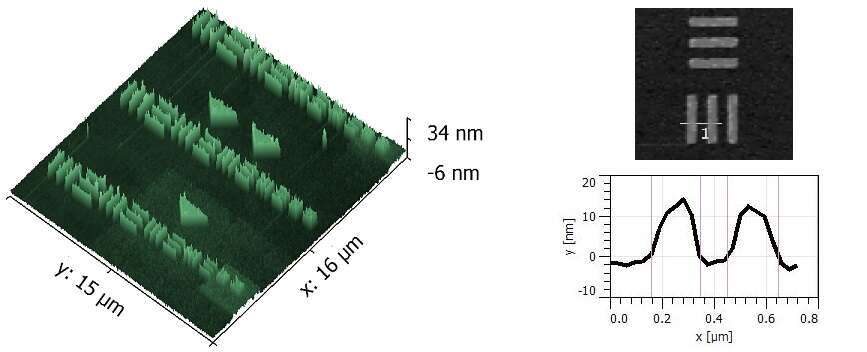
Fig. 2. An AFM image of a typical gold nanolines sample. (a) A wide area AFM scan. (b) A height line profile of the zoomed area [marked by a red rectangle in section (a)], taken along the nanolines normal (shown by a horizontal line in the inset).
We demonstrated that an active scanning of the sample by HOT-trapped nanospheres allows features down to the size of the scanning particles to be resolved. Our technique does not require sample staining, which is a great advantage compared to most other SR technologies, where sample labeling by switchable fluorescent markers challenges preparation of bio-samples. The proposed biocompatible and noninvasive SR imaging thus opens new directions for future applicative engineering.
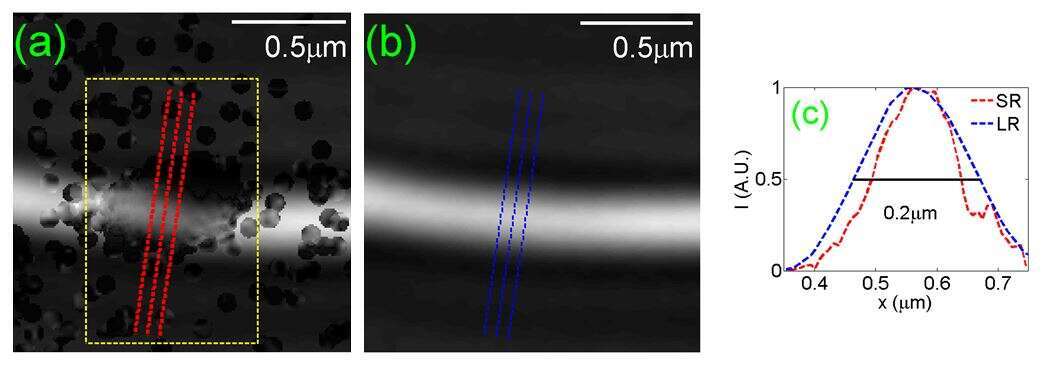
Fig. 3. An enhancement of resolution, as obtained for a nanowire, Section (b) show the conventional confocal image of the samples. The regions where the SR resolution scanning was carried out appear in the yellow rectangle as dark blobs in (a). Note the dramatic enhancement of resolution, where the nanowire appears much thinner in the SR-scanned region. The corresponding intensity profile is shown in (c), where the intensity profiles were averaged over the dashed lines in (a,b).
1. A. Gur, D. Fixler, V. Micó, J. Garcia, and Z. Zalevsky, "Linear Optics Based Nanoscopy," Opt. Express 18, 22222 (2010).