Neurodevelopmental-Related Health Inequalities among Children Screened for Biotinidase Deficiency (BTD) in a Local Scottish Local Authority
2Clinical Biochemistry Department, NHS Fife
Background: Deprivation is the key determinant of health inequalities, accounting for the unequal socio-economic patterning of outcomes which disadvantages less affluent children. It is influenced by a wide range of factors including access to education, employment and good housing, access to healthcare, income levels and genetic factors.
Aims: To examine socioeconomic inequalities (SEI) in the incidence of clinical diagnoses among children screened for BTD in Local Authority (LA).
Methods: We retrospectively reviewed the clinical and laboratory data of all children throughout NHS Fife area screened for Biotinidase deficiency (BTD) over a two- year period between July 2014 and July 2016.
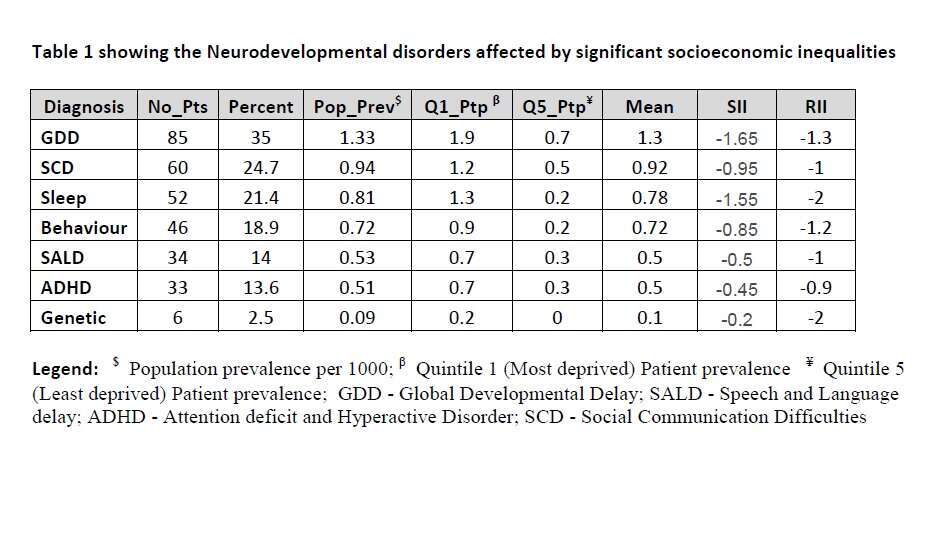
SEI was calculated using the Slope Index of Inequality (SII) and the Relative Index of Inequality (RII) based on the linear regression coefficient between the proportion of patients in each 20% (Quintile) of data zones for each patient and the hierarchical ranking value of each Quintile. The RII is calculated by dividing SII with the mean level of patient proportion.
Results: Analysis of the patients’ Neurodevelopmental diagnosis confirmed that only seven out of 40 different diagnostic conditions showed evidence of significant socio-economic inequalities in their distribution among children and youth screened for BTD, i.e Global Developmental Delay (GDD), Speech and Language delay (SALD), Attention deficit and Hyperactive Disorder (ADHD), Social Communication difficulties (SCD) but not Autistic Spectrum Disorder, Sleep and Behaviour difficulties, and Genetic disorders (Table 1). RII was 0.9 to 1.3 for the seven conditions.
Conclusion: This study has shown that children in the most deprived areas of the LA have significantly worse health compared to those living in other areas with regards to some neurodevelopmental conditions mainly Genetic disorders, Global, Speech, Language and Social Communication delays, ADHD, behavioural and sleep difficulties. Similar studies in other Scottish LA will be helpful to compare this finding among the children population.


Powered by Eventact EMS