Minimally invasive micro-endoscopes have been developed as a strategy to get high spatial resolution while one can both insert the device deeply into the target area and implant it for a long time for monitoring purposes. This overcomes limitations of real non-invasive approaches with spatial limited resolution such as magnetic resonance imaging (MRI), computed tomography (CT), high and low frequency ultrasound (US). Furthermore, it also bypasses the limitations of high spatial resolution techniques, such as multiple photon fluorescence or confocal fluorescence that are applicable only at shallow interrogation depths and lack the ability to conduct long time observations. Combining capabilities to image through scattering medium enhances the technique capabilities and makes less harm to the imaged organ. Importantly, this could be of high value for retinal imaging, where delicate elements such as choroidal blood vessels are needed to be imaged beyond different cell layers.
Here we present a high spatial resolution setup based on a lensless, minimally invasive single mode fiber [1]. Our method allows for imaging to be done at a certain working distance above the surface, without interference to the imaged object. Fast overlapping scans enlarge the region of interest and enable dramatic signal to noise enhancement. The overlapping scans also allow employing of post-processing super-resolution algorithms. Having 5000 inner cores, each is 835 nm in diameter with 2.3 μm pitch between nearest cores, this setup can both image with high resolution and perform data collection for long time periods. This yields continuous knowledge on micron sized cells and organ sections. In-vitro imaging results of weak ARPE cells signals and rat retina are presented. Imaging beyond a scattering tissue is demonstrated using Hemoglobin filled microchannel made of Polydimethylsiloxane (PDMS) covered by intralipid in different widths.
Our experimental setup is schematically described in Fig. 1. White light emitting diode illuminated the sample from two positions - from below the sample for transmission mode, and from above it for reflectance mode. The scanning end of the optical microendoscope was located above the sample. A V-groove holder, axially positioned, held this end and translated using 3-axis motorized stage. The external end of the optical microendoscope was positioned and aligned within the focal plane of 20X objective, which in turn was coupled with a CMOS camera.
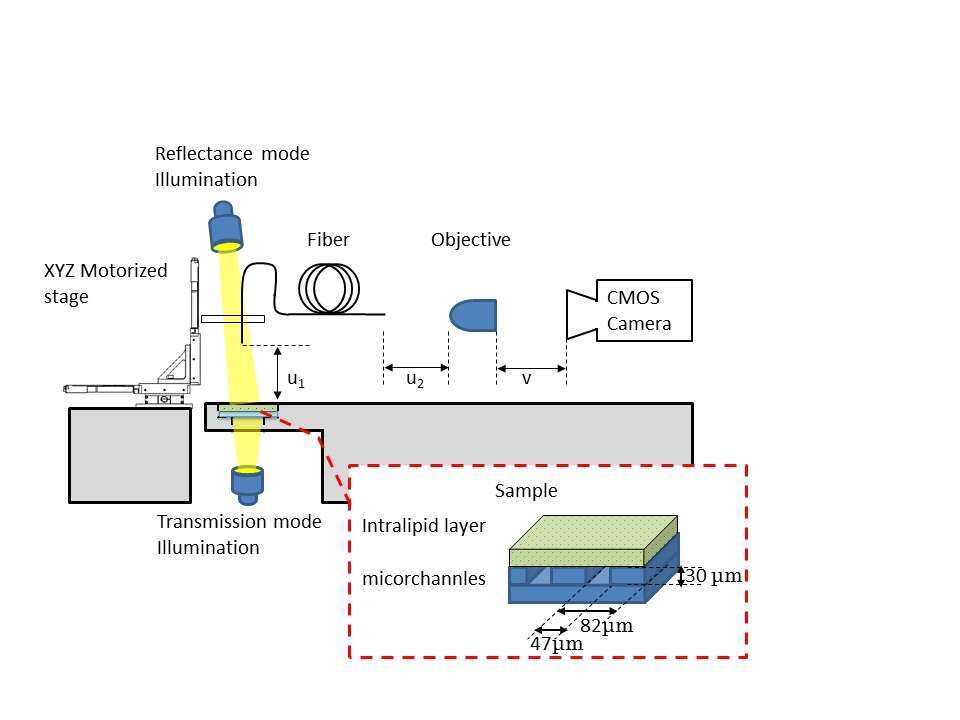
Fig. 2 shows the resulting imaging for the hemoglobin filled capillaries. Each rectangle shows the results of imaging with different width of the intralipid scattering medium. For each width, the whole scanned area is shown on the left, a zoomed image is shown in the middle and the intensity distribution along the red line in the zoomed image is shown on the right. Imaging without any layer (a-c), yielded 47.3 µm line width with a contrast value of 0.45. Adding a 240 µm thick diffusive layer, 47 µm line width with a contrast value of 0.31 was measured (d-f). Increasing the thickness to 320 and 360 µm the line broadened in 3 microns and the contrast dropped to 0.27 and 0.2 respectively.
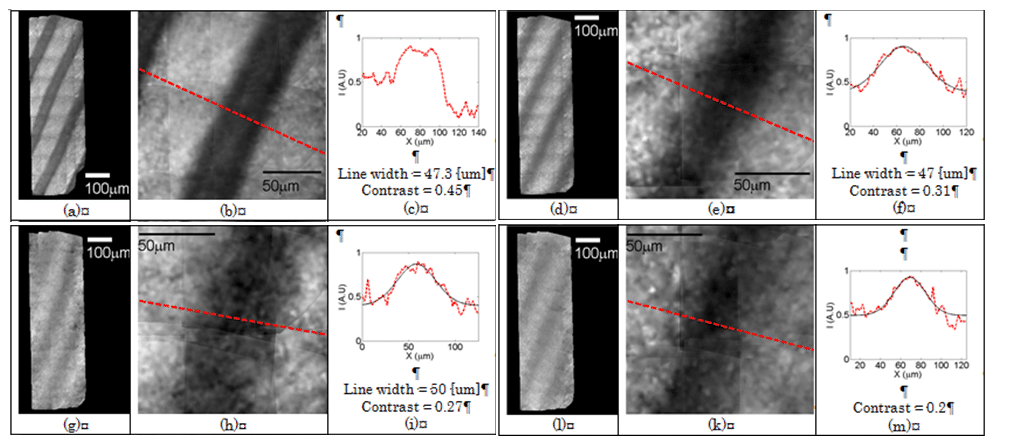
Fig. 3 shows the resulting imaging for non-labeled ARPE cells. Taking acquisitions with 20 μm translations allowed image stitching and applying super resolving (SR) algorithms leading to a single cells images. The red dashed rectangle area in the figure (a) is zoomed. The intensities of a raw image (b) are highly fluctuating and noisy. In each image the cores intensities are extracted and flat-corrected (c). Note the narrow fiber sampling to estimate the sampling density in comparison with the cells. The ARPE cells can clearly be distinguished after image stitching and SR algorithms (d). Their morphology could further be examined with the higher resolution.
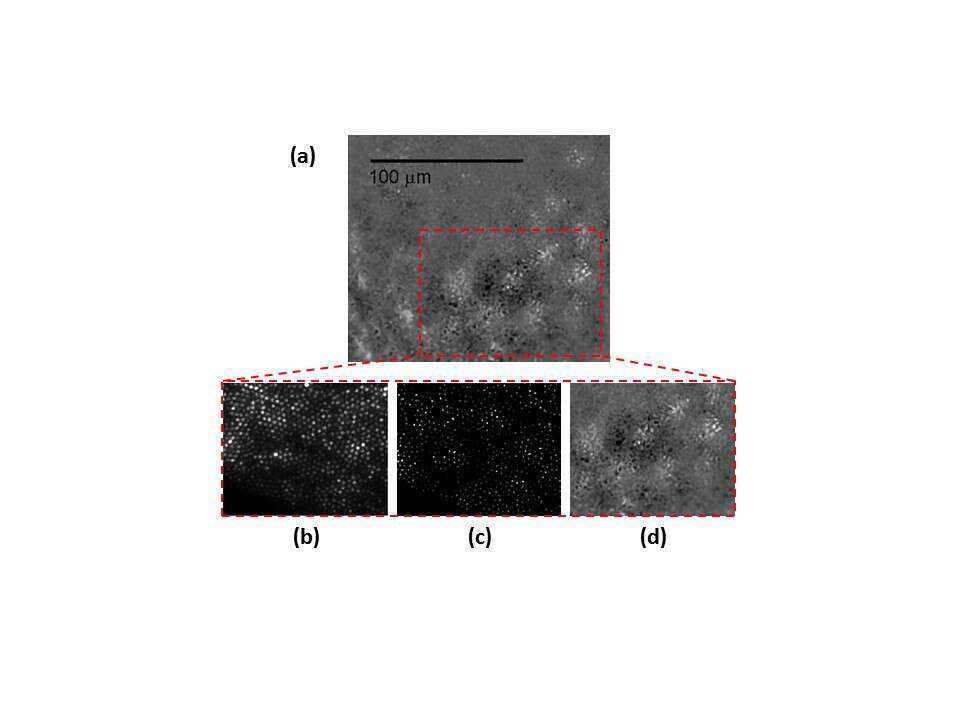
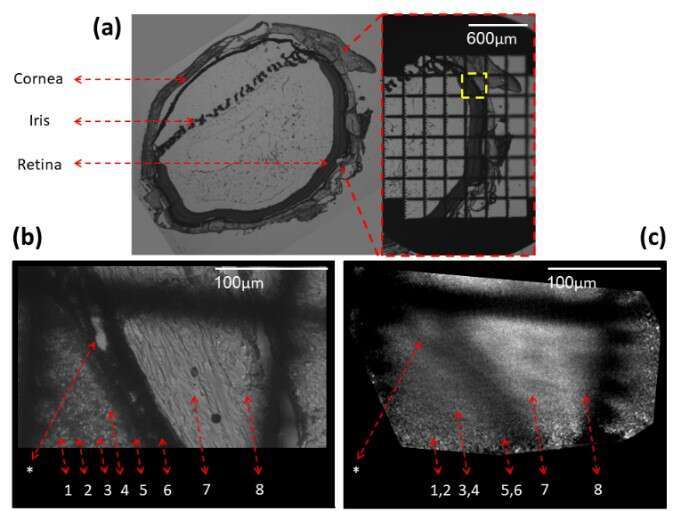
Fig. 4 shows 5 µm thick sliced rat retina imaging. On the left of (a) slice is shown using a phase microscope with a X4 magnification, the slice was then marked using a grid target and imaged again (b). A location marked by a yellow dashed rectangle was chosen, imaged with X20 magnification, and then scanned using our fiber. In the phase contrast image (b) the different retinal layers can be identified and numbered by the labels under the dashed red arrows. A distinct choroidal blood vessel (marked by an asterisk) is clearly seen. The fiber scan image, scanned with 10 μm translations at the same square area found using the grid target, is shown in (c). The scan succeeded to resolve the 10μm width choroidal blood vessel (marked by an asterisk).
The asterisk and Numbers 1-8 label: Choroidal blood vessel (*), Inner nuclear layer(1), Outer Plexiform layer(2), Outer nuclear layer(3), Outer segments(4), RPE – pigmented epithelium(5), Choroid(6), Sclera(7) and Conjunctiva(8).