
Misleading 3D Activation Mapping post Cavotricuspid Isthmus Ablation
Background: High density 3D mapping for typical atrial flutter (AFL) ablation provides a highly detailed voltage and activation map.
Objectives: Describe misleading results of high density 3D activation mapping post cavotricuspid isthmus (CTI) ablation.
Methods: 3D electroanatomic voltage and activation mapping of the RA was performed in 15 consecutive patients (pts) with typical AFL, using the Ensite Precision (St. Jude Medical) with a Halo catheter pre and post ablation.
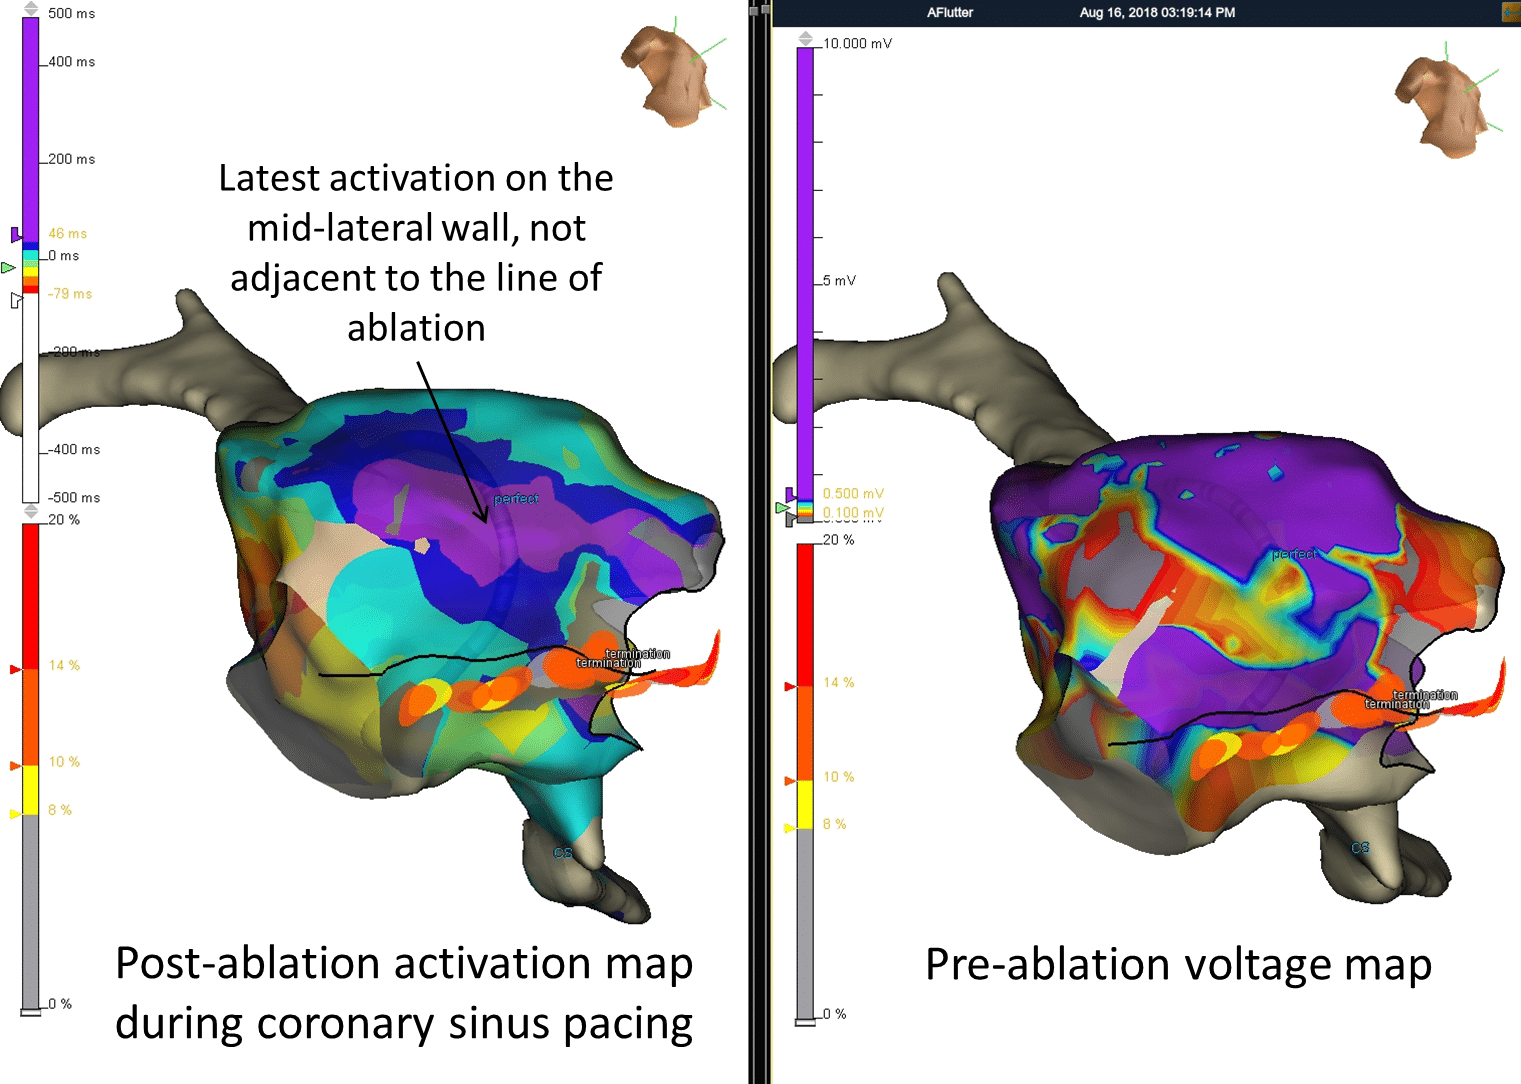
Results: Activation and entrainment mapping confirmed CTI dependent AFL in all pts. Mean number of map points was 611±312. Lateral low voltage areas were seen in 10 (62.5%) pts. Post ablation activation map during CS pacing (available in 6 of the 10) demonstrated latest activation on the lateral wall aligned with the low voltage areas and in 3(33.3%) pts this was later than just lateral to the CTI ablation line masquerading as a gap in the ablation line. However, bidirectional block was confirmed by differential pacing, widely split double potentials on the ablation line and non-inducibility. Failure to recognize this misleading activation map in 2 pts resulted in delivery of significantly more ablation lesions (34 vs. 19, p=0.0007). At follow-up of 4±3 months, there were no recurrences.
Conclusions: Areas of low voltage in the lateral right atrium may lead to slow conduction mimicking a gap in the ablation line. Comparing pre-ablation voltage to post-ablation activation map can identify areas of low voltage with slow conduction. The use of other maneuvers can prove bidirectional block and avoid further unnecessary RF delivery.

Powered by Eventact EMS