
The Effect of Therapeutic Ultrasound on Angiogenesis and Perfusion in a Rat Model of Femoral Ischemia
2The Cardiology department, Galilee Medical Center
3The Azrieli Faculty of Medicine, Bar-Ilan University
Ultrasound is lately used as therapeutic tool. Therapeutic ultrasound (TUS) physically stimulates biological responses. Studies showed that TUS stimulates angiogenesis; however, its clinical application needs further research. We hypothesized that non-invasive TUS at relevant parameters may augment angiogenesis. We studied several TUS profiles for angiogenesis efficacy. Angiogenesis was evaluated physiologically by Galectin-1 expression and by tube formation.
Methods: We used an in vitro model of human endothelial cells, with or without TUS. In rats we applied permanent ligation of an intra-muscular femoral artery branch. We evaluated ischemia by physiological measurements at baseline, before first TUS treatment and after last treatment. Galectin-1 expression was examined immunohistochemically.
Results: We assessed tube formation by the area occupied by tubes, loops and branching-points number. These parameters were 13.2±3.0%, 19.2±7.2 and 27.5±6.7, respectively, in the control, and increased following f=1MHz I=0.05W/cm2 TUS to 24.2±3.9%, 31.0±5.2 and 34.2±5.1, respectively (P<0.05). Concomitantly, this profile increased pre-treatment perfusion and sum intensity of Galectin-1 expression from 0.06±0.02 ml/min and 45994±38190 pixels to 0.14±0.04 ml/min (~6 folds) and 272835±291155 pixels (~2.3 folds), at final measurements, respectively.
Conclusion: TUS at specific parameters may be used as an adjunct to the current angiogenic methodology or as a new method for augmentation of angiogenesis in chronic ischemic tissues.
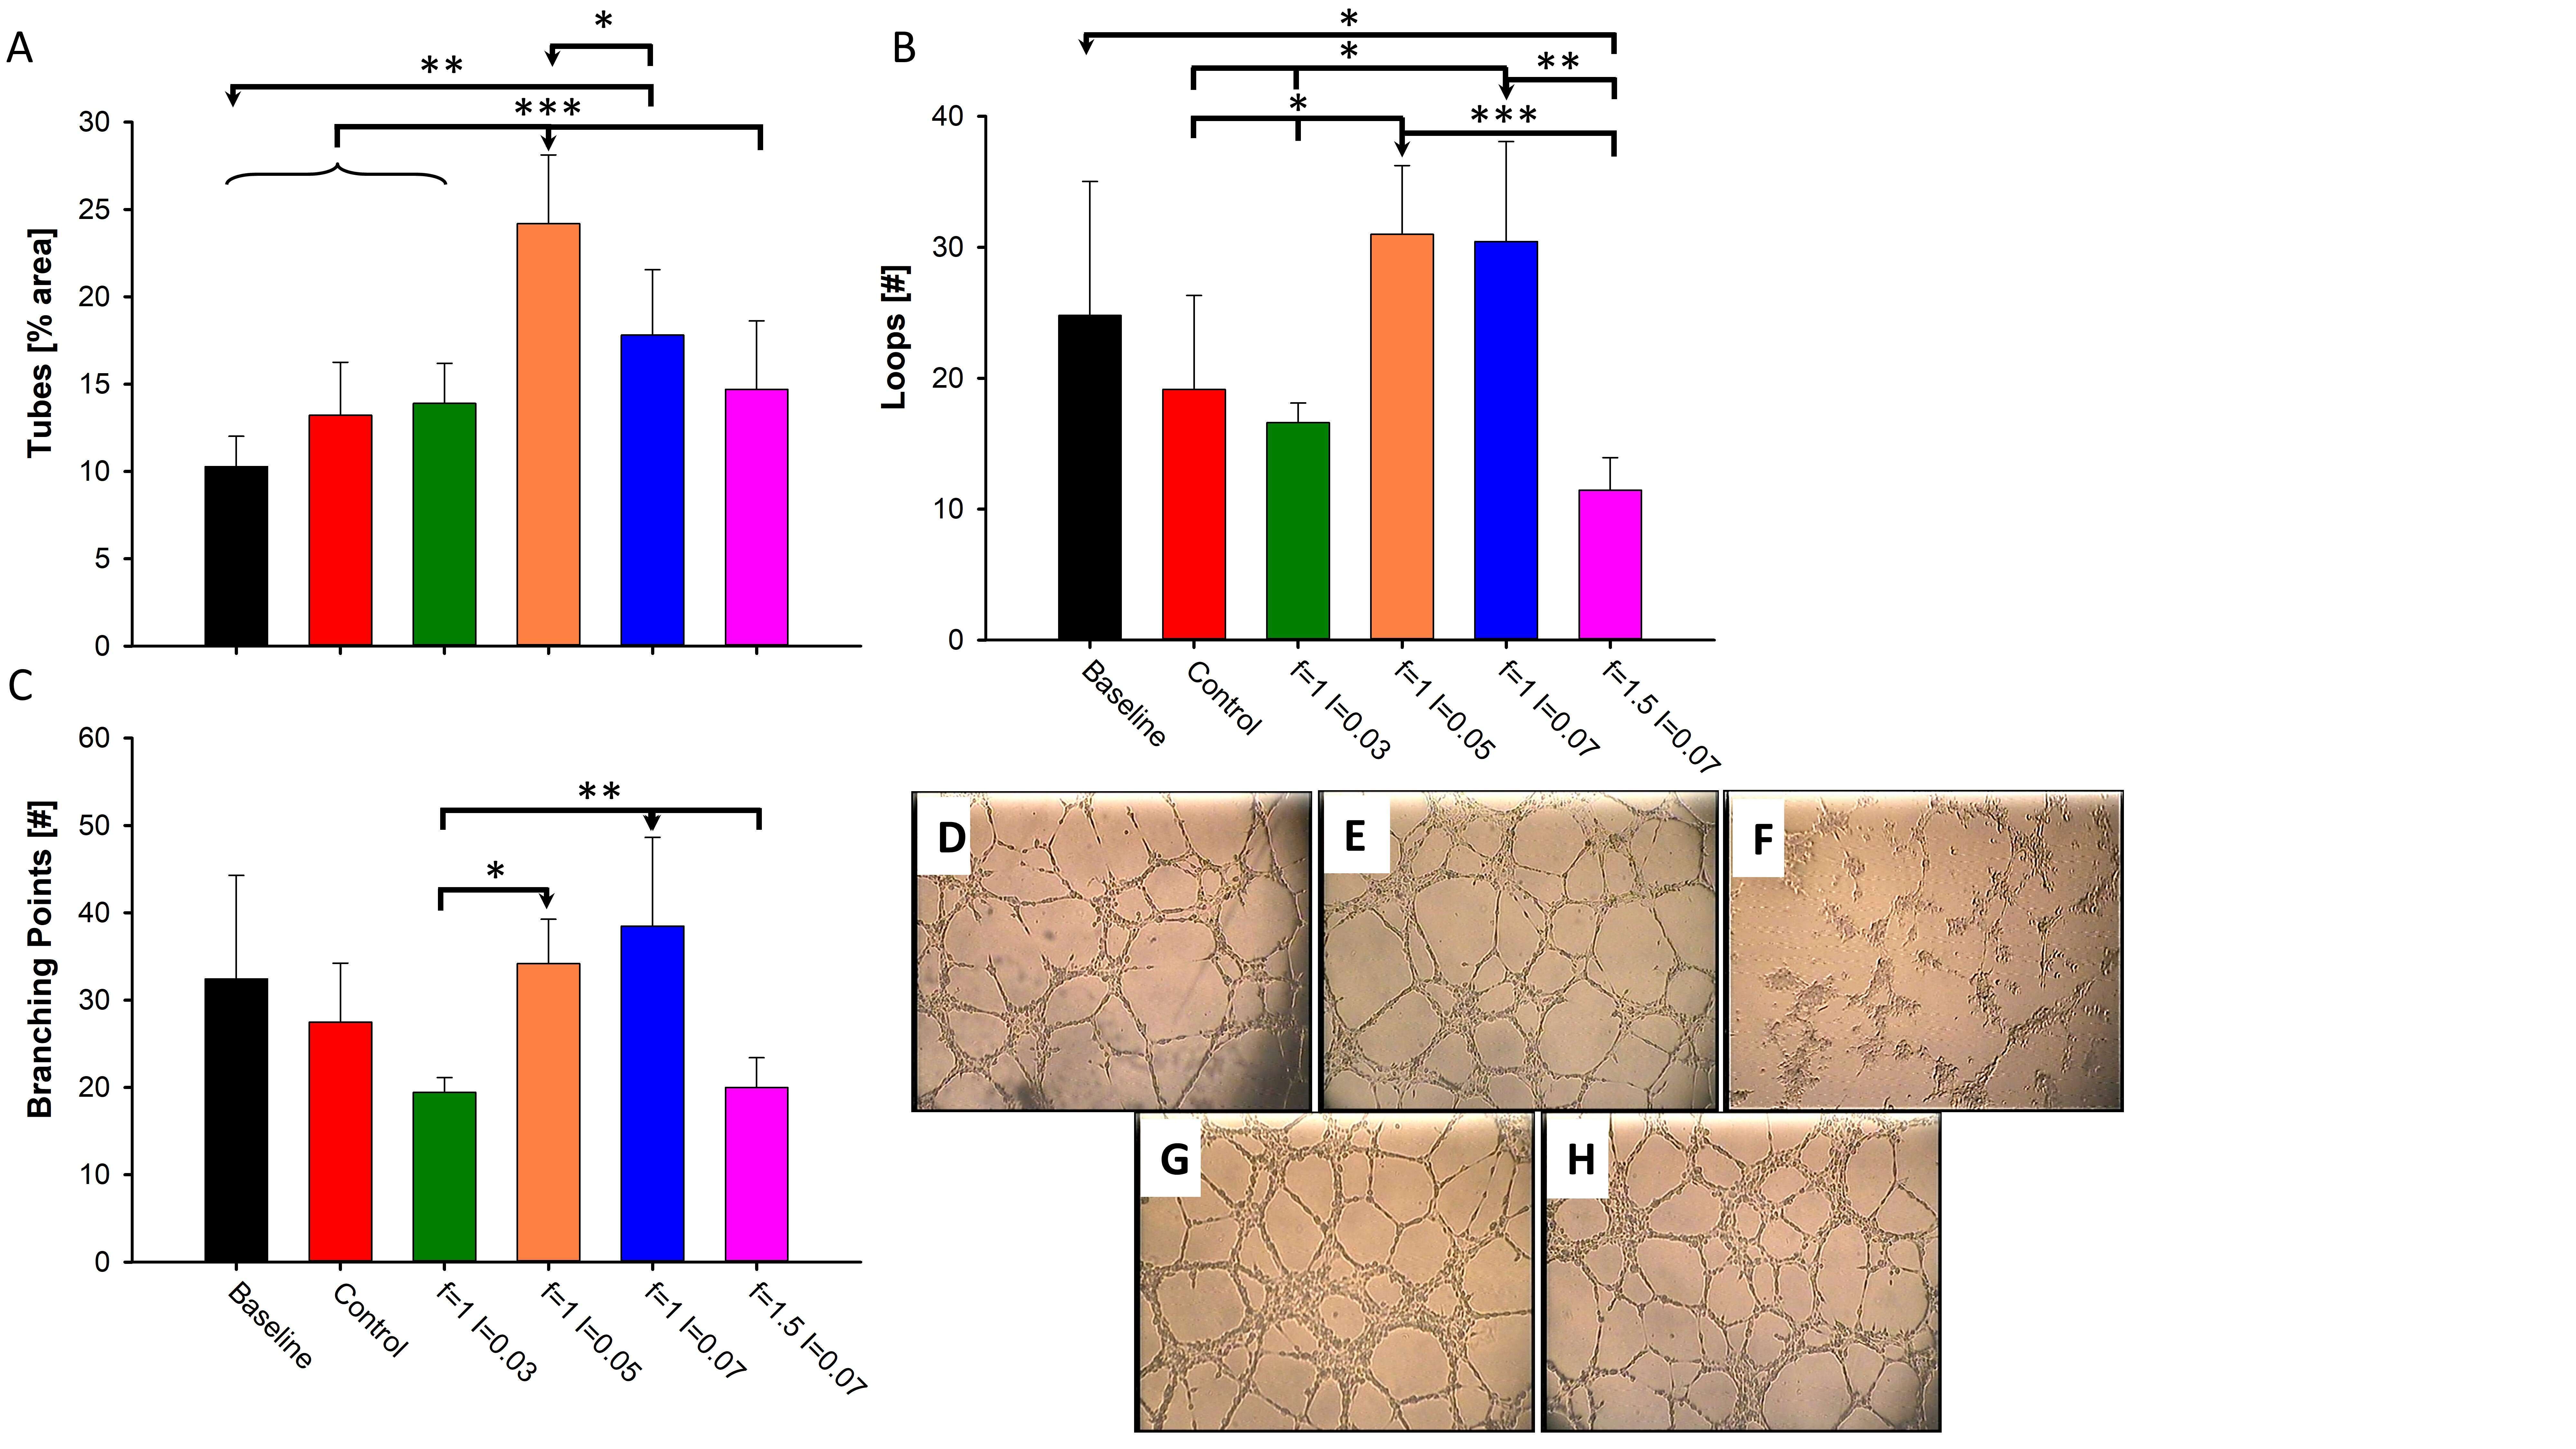
Figure 1: HUVEC tube formation assay. A. % Area occupied by tubes, B. Number of loops C. Number of branching points. For each profile a designated column composed of 5 independent experiments (n=5). Baseline - before treatment and Control - without treatment. D-H representetive pictures D. HUVEC before the TUS. E. Without treatment. F. f=1 MHz I=0.03 W/cm2. G. f=1 MHz I=0.07 W/cm2. H. f=1 MHz I=0.05 w/cm2 (x40 magnification). * P<0.05, **P
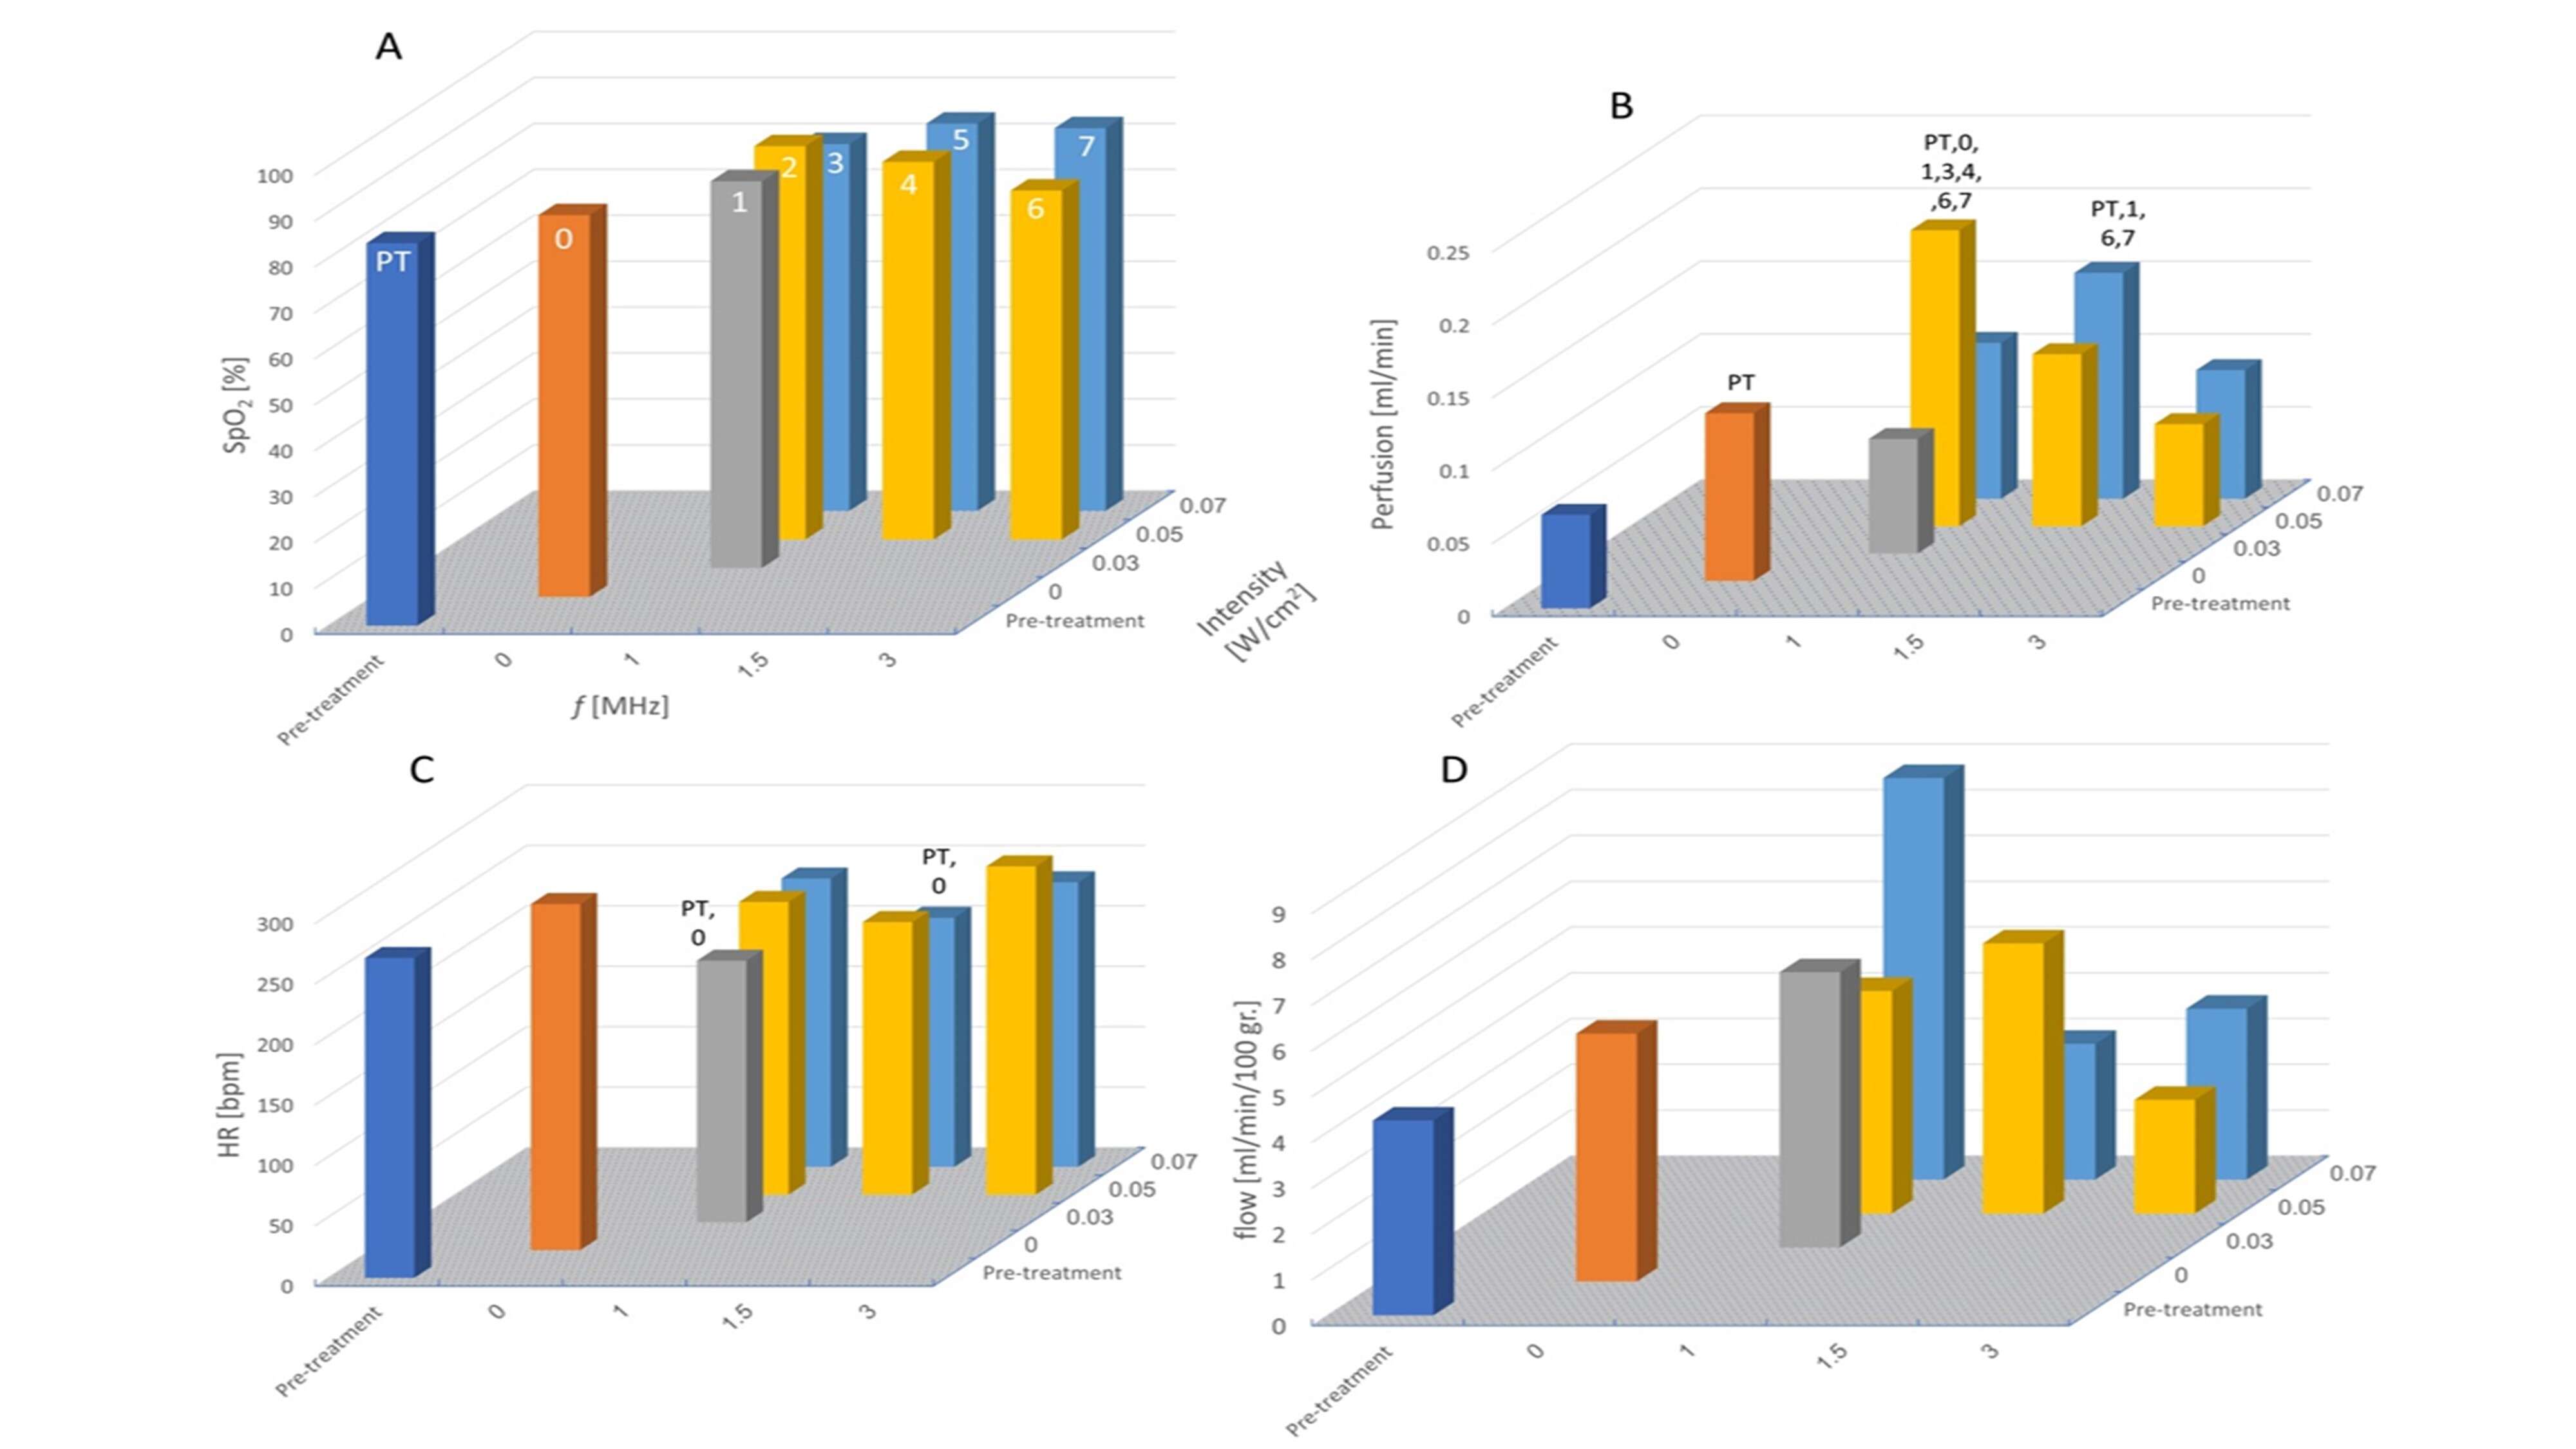
Figure 2: Physiological parameters measured in rat hind-limbs at pre-treatment and in the final measurement. Each treatment group is recognized by its ultrasound frequency (f) on the x axis, intensity (I) on the y axis and on the z axis the magnitude of the parameter is presented A. SpO2, B. HR, C. Perfusion and D. Flow. Each group was given a symbol, which is depicted on the SpO2 plot (white color numbers), significant difference is presented as the symbol of the group over the group it differs of.

Powered by Eventact EMS