A Model for Pedestrian Crossing using PNF
More than 1.2 million people die in road crashes each year (35% of which are pedestrian deaths). We propose a new model for formulating the dynamics of the interaction between drivers and pedestrians at congested conflict spots where drivers and/or pedestrians do not closely follow the traffic laws. The model is based on the Probabilistic Navigation Function (PNF) [1], originally developed for robotics motion planning, that constructs a trajectory according to the probabilistic collision risks. The risk map assigns the entire crossing area with probabilities for a collision with vehicles. Pedestrian then select their actions based on their perceived probability for collision. The development of the model follows a theoretical and experimental investigation of pedestrian/vehicle interactions at crosswalks. The model is implemented in an agent-based simulation system for pedestrian/driver interaction, and is validated using video clips taken at several congested road spots. The model can be as a design tool, as a standard tool in simulations for assessing accident risks in urban environments and can be utilized in control systems of autonomous vehicles and in drivers’ on-board alert systems.
A pedestrian waiting to cross a road as shown in Fig. 1a. detects the vehicle approaching, and constructs a PDM which represents the probability of the vehicle to be at various locations for a time period. The PDM is updated dynamically based on the data perceived by the pedestrian [2]. Fig.1b, that represents the possible locations of the vehicle given its current speed and possible maneuverability (interior lines indicate higher probabilities). The PDM (marked by ptot)is confined to the physical constraints while its center is determined to be at a distance v*Δt (v- is the current speed of the vehicle and Δt is the Time To Safety).

In [2] the PNF is applied to a dynamic environments. Using the PDMs of all objects, consecutive PNFs are constructed. Following the PNF’s gradient guarantees that the probability for collision with objects is reduced while converging to the target positions.
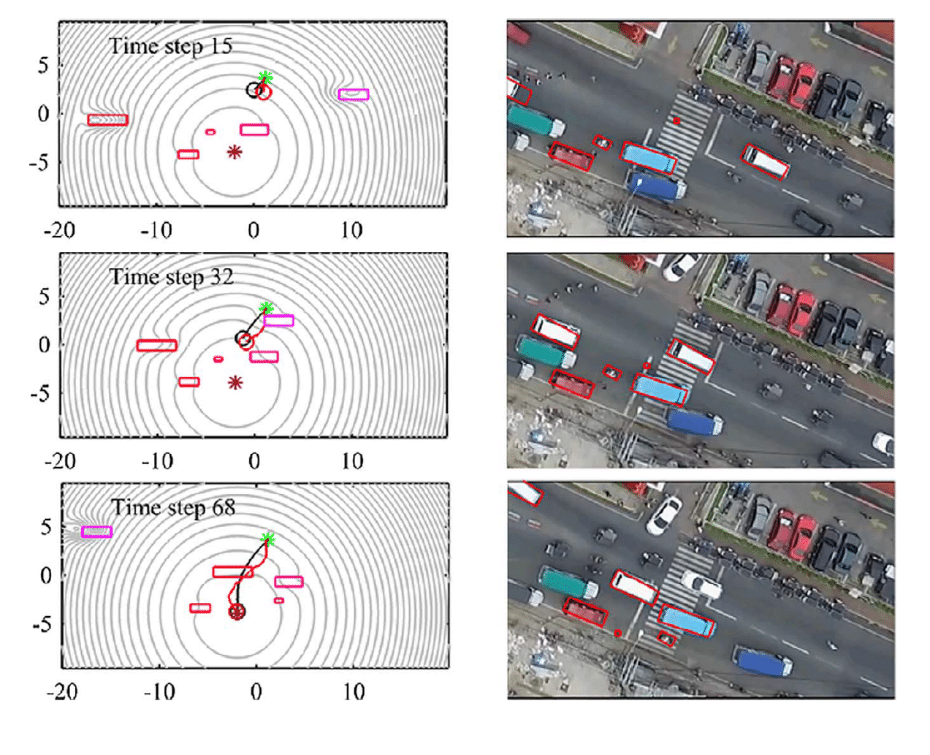
Figure 2 shows a set of frames from a video filmed in Lipa, Philippines. The simulated trajectories (black) closely follow the real trajectories (red), with an average offset of 0.35 m and standard deviation of 0.15 m along the trajectory. The actual video clips and the construction of the simulated trajectories can be seen at: https://www.youtube.com/watch?v=2_vX51EI4Yg.

Table 1 demonstrates the average difference between the actual and simulated trajectories in the range of 11–40 cm. Where the target is area of a 2 m radius disk located about 5 m beyond where the real pedestrian ended the crossing

References:
[1] Hacohen, S., Shoval, S., & Shvalb, N. (2016). Probability Navigation Function for Stochastic Static Environments, arXiv preprint. arXiv preprint arXiv:1508.06071.
[2] Hacohen, S., Shvalb, N., & Shoval, S. (2018). Dynamic model for pedestrian crossing in congested traffic based on probabilistic navigation function. Transportation research part C: emerging technologies, 86, 78-96.
[3] Hacohen, S., Shoval, S., & Shvalb, N. (2017). Applying probability navigation function in dynamic uncertain environments. Robotics and Autonomous Systems, 87, 237-246.
iem@ortra.com מייל לשאלות

Powered by Eventact EMS