
The CubeSat Radiometer Radio Frequency Interference Technology (CubeRRT) Validation Mission:
First Ever Space-borne Demonstration of Real-Time Interference Filtering
2ECE, Ohio State University
3*, NASA GSFC
4Astrophysics, Caltech
5BCT, BCT
The CubeSat Radio Frequency Interference Technology (CubeRRT) Validation mission is the first ever technology demonstrator to detect and filter out radio-frequency interference (RFI) over a wide-bandwidth onboard the spacecraft. CubeRRT represents a technological advancement to counter the increased crowding of spectrum allocations, and preserve the integrity of passive microwave observations against RFI.
Currently, nearly 90% of the bandwidth between 6 to 40 GHz is allocated for non-Earth exploration use. Earth observation satellite systems have a limited spectrum to operate in. RFI has resulted in increased noise and bias in geophysical science retrievals from passive microwave measurements. An RFI detection algorithm is harder to implement at wide measurement bandwidths that exist at higher microwave observations, and resulting in extremely high data downlink rates. The CubeRRT mission was designed to filter out RFI signals and salvage any remaining clean signals using advanced statistical techniques over a much wider bandwidth and performs RFI detection onboard the spacecraft.
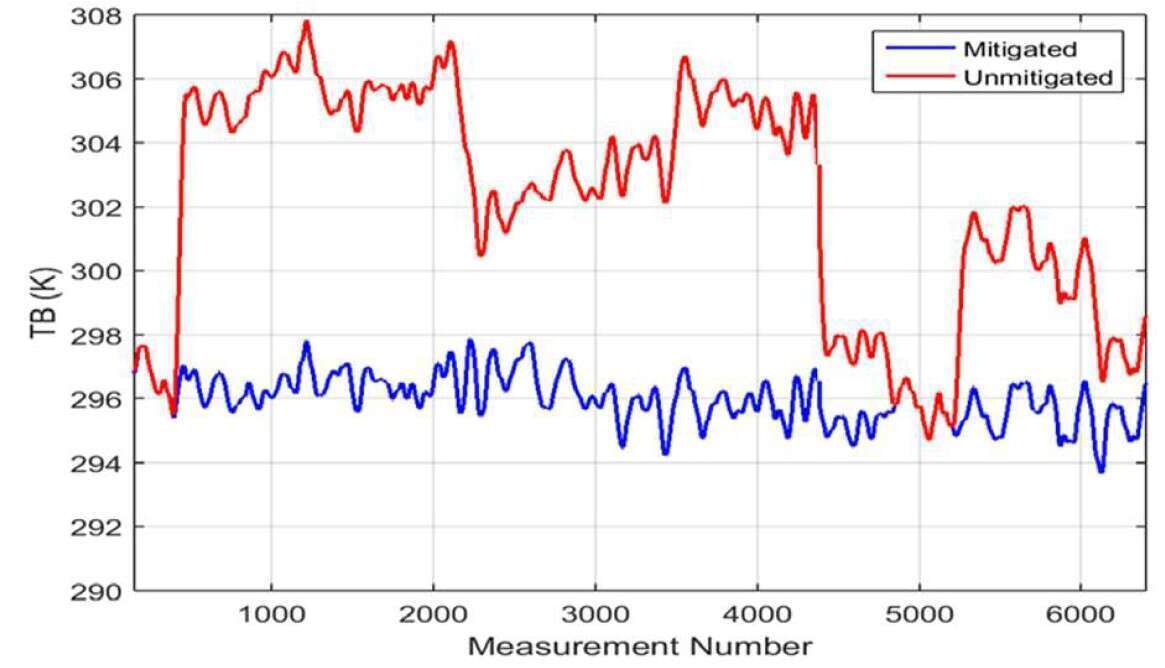
The CubeRRT mission can ingest 1 GHz of radiometric measurement bandwidths at microwave frequencies from 6 to 40 GHz and perform onboard filtering. CubeRRT successfully demonstrated and validated the onboard operation of complex RFI filtering algorithms. The backend has collected more than 300 hours of data. In the figure, blue plot represents the on-board filtered signal and the red plot represents the RFI corrupted signal.

Powered by Eventact EMS