
Evaluation of the economic feasibility of electrogenic bioreactors for wastewater treatment
Microbial Fuel Cells and Microbial Electrolysis cells are examples of electrogenic bioreactors having anode respiring bacteria that reduce the anode potential. These have been studied extensively in application to wastewater treatment, potentially generating or producing resources directly out of the wastewater treatment process (Logan et al, 2006).
Microbial fuel cells (MFC) most commonly generate current by coupling a bio-anode with an oxygen reduction cathode. Electrons and protons created at the anode travel towards the cathode through conductors and an electrolyte respectively, to reduce oxygen to water there.
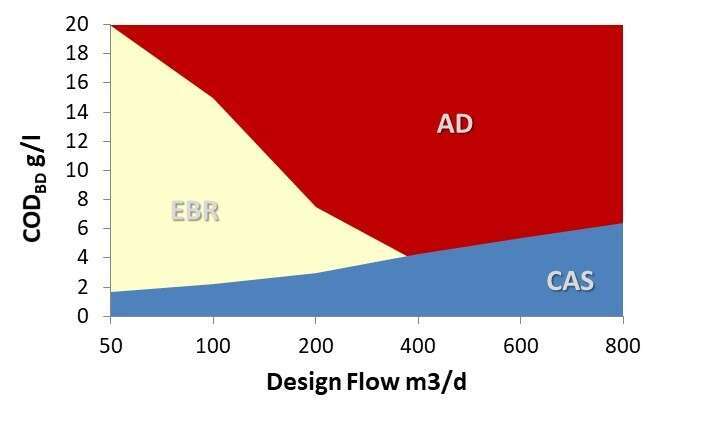
The development of MFC for wastewater treatment must result in an economic benefit over existing alternatives. This might be achievable through power generation, energy saving and less excess sludge for disposal on one hand, and high performance and low-cost components on the other hand. These components include electrodes, catalyst, oxygen permeable membrane, current collectors, conductors, isolators, flow spacers, power converters. The results of many years of MFC development are expressed in figure 1 in terms of life cycle cost relative to alternatives.
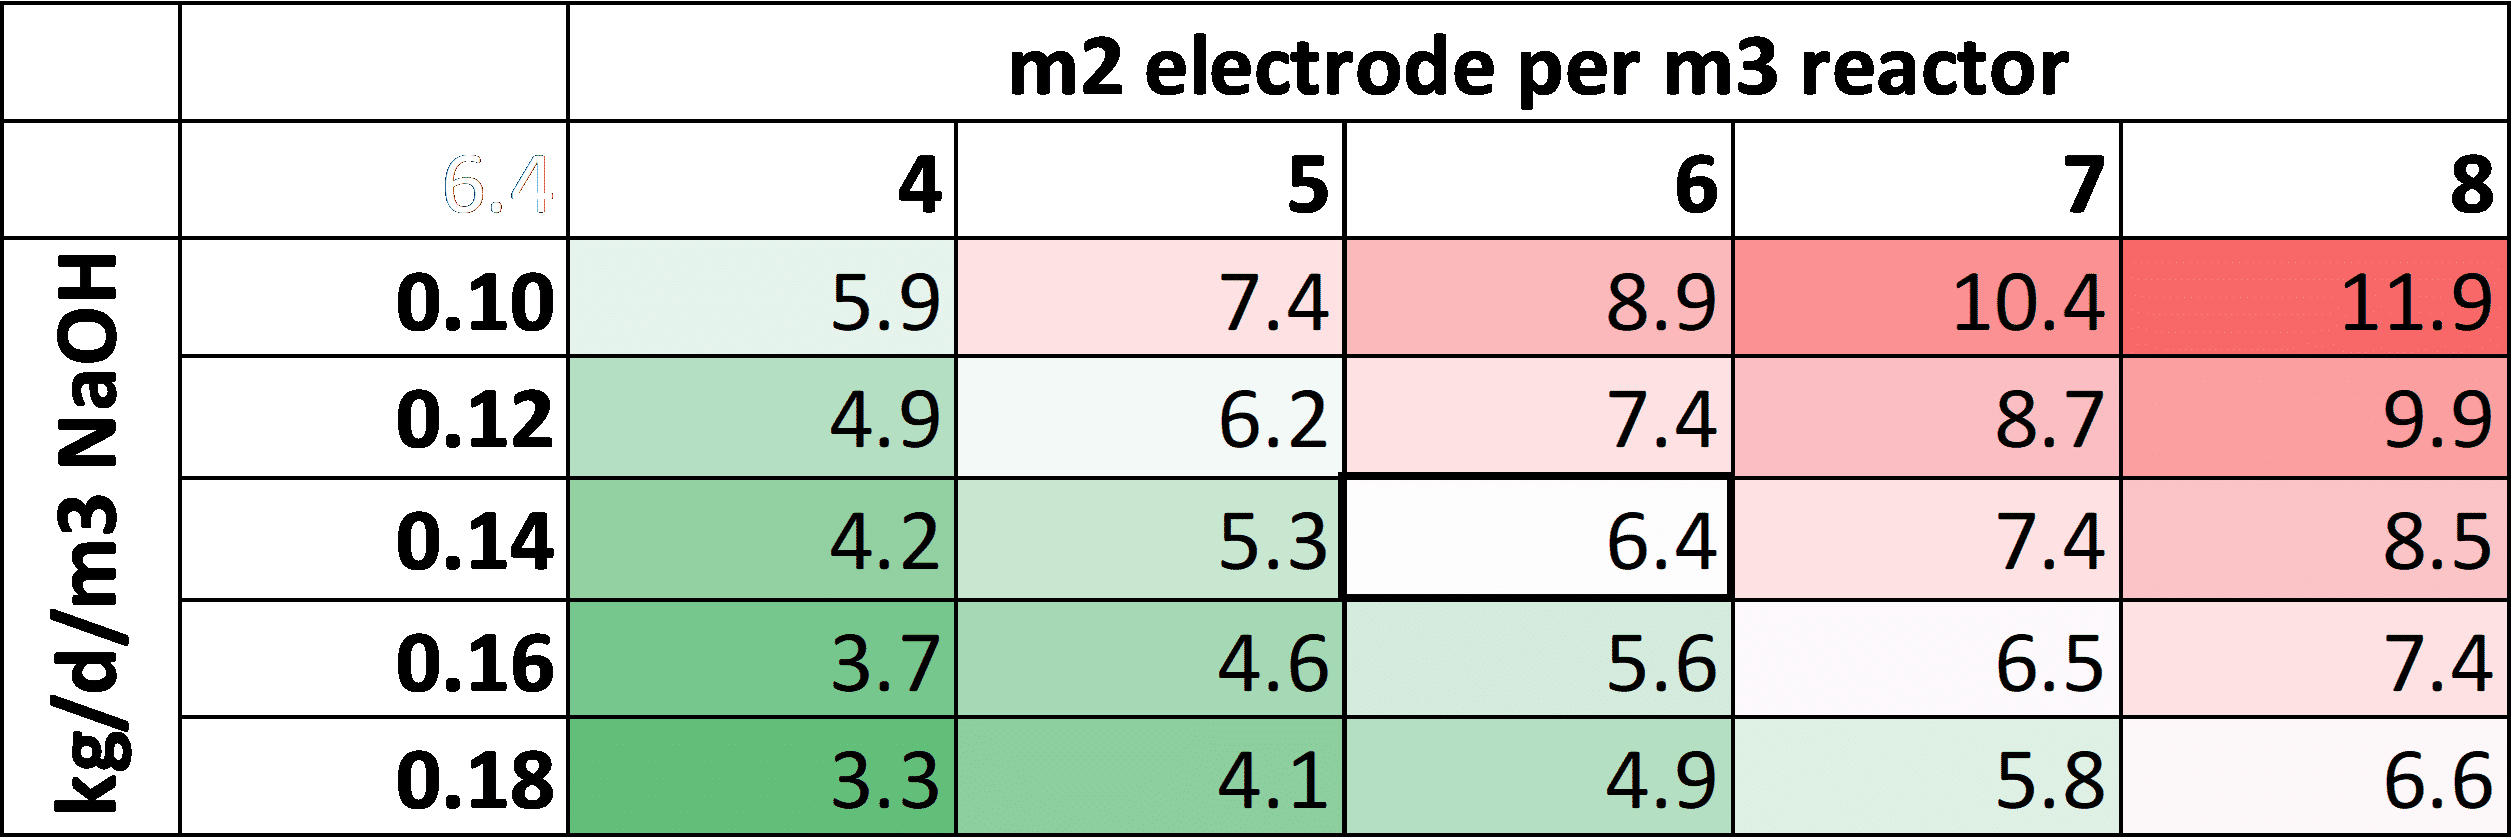
Microbial electrolysis cells (MEC) use the anode potential to reduce the applied voltage required from an external power supply for the synthesis of different products such as hydrogen, while also treating wastewater. Due to complexity and cost of valuable hydrogen recovery, a different application is considered, wherein the MEC is coupled with an anaerobic digester (AD) that utilizes the hydrogen for the benefit of improved performance and improved biogas quality (De Vrieze et al, 2014, Yin et al, 2015). The structure of MEC is similar in principle to MFC but comprise less components. Their potential value proposition for AD includes higher quality of biogas, increasing the treatment capacity and process stabilization by taking up and preventing the unwanted accumulation of volatile fatty acids. The condition for MEC economic feasibility in terms of surface area per unit volume AD for different equivalent alkaline dosing are shown in figure 2.
Powered by Eventact EMS