")
LIGHTSHEET AND CONFOCAL MICROSCOPY ANALYSIS REVEALS THE MORPHOLOGICAL SEQUENCE GROWTH PLATE CELLS UNDERGO AND THE REGULATORY ROLE OF GDF5 IN THIS PROCESS
2LIS (UMR 7020), IBDM (UMR 7288), Turing Center for Living Systems, Aix-Marseille University, Marseille, France
3Institute of Imaging and Computer Vision, RWTH Aachen University, Aachen, Germany
4Department of Life Science Core Facilities, Weizmann Institute of Science, Rehovot, Israel
Our ability to grow depends on proper functioning of our bones. At either end of a developing bone is an engine-like tissue called the growth plate whose activity level gives rise to different bone lengths. The growth plate is divided into four zones from its end toward the center of the bone, forming the resting zone (RZ), proliferative zone (PZ), prehypertrophic zone (PHZ) and hypertrophic zone (HZ)1. A major hallmark of growth plate activity is the extreme changes in size and shape its cells undergo during the period of bone growth as they move through the different zones2. For example, HZ cells increase their volume 9-fold compared to cells in the RZ3,4, while PZ cells flatten and undergo a 90˚ rotation during cell division, creating column-like structures5,6. Although both of these cellular processes were shown to be essential drivers of growth plate activity3-6, the connection between growth plate activity and bone length is still poorly understood.
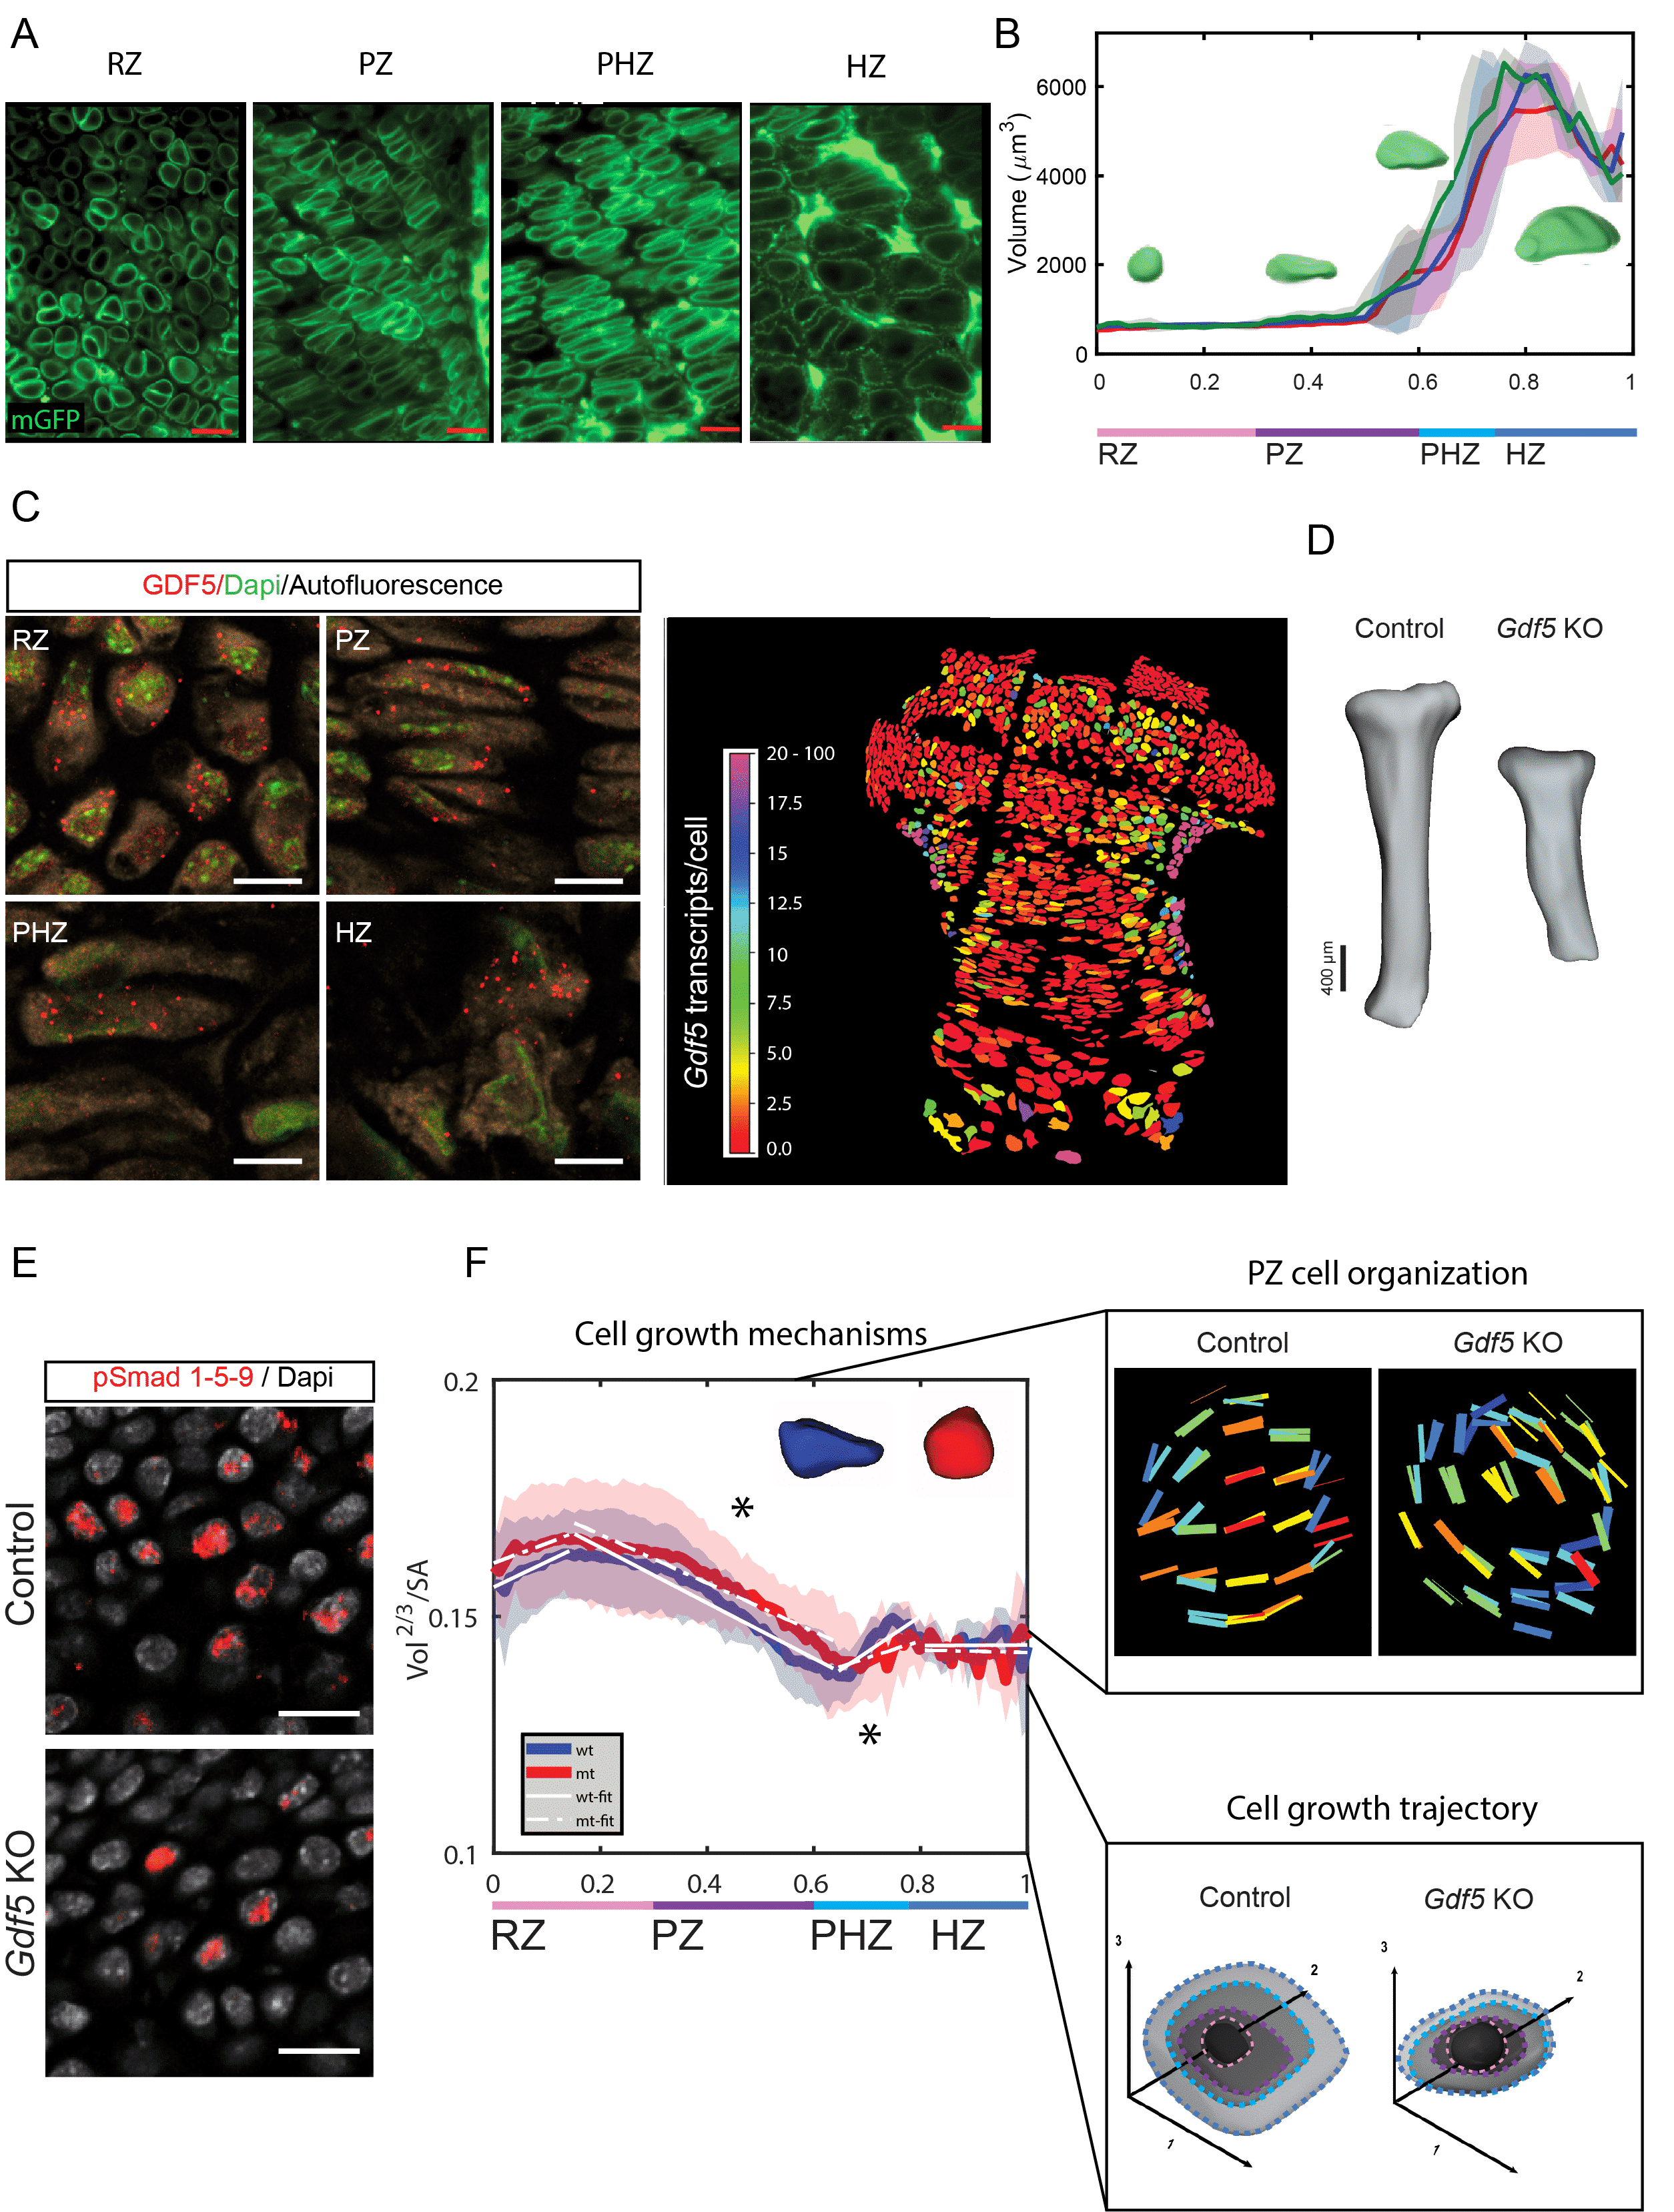
To fully understand this connection, analyses across the tissue, cell, and molecular scales need to be integrated. The innate structure of the growth plate has prevented such studies, as its large size, high cell density, and extracellular matrix (ECM) composition creates major challenges in imaging the entire tissue at sub-cellular resolution. To overcome this major obstacle, we combined lightsheet fluorescence microscopy (LSFM) with bone clearing to study cell growth and morphogenesis in the growth plate and utilized confocal microscopy to resolve molecular regulators of these processes (Fig. 1A).
To explore 3D morphogenesis of hundreds of thousands of growth plate cells we developed a pipeline called 3D Morphometric Analysis for Phenotypic significance (3D MAPs). This analysis revealed that contrary to the paradigm that most cell growth occurs in the HZ with a rapid 9-fold increase in volume, cell growth is a gradual process where 65% of total cell volume enlargement occurs before cells reach the HZ (Fig.1B). This new finding shows that cell volume defects in any zone can result in abnormalities in bone height.
To decipher the cellular processes responsible for bone growth and to demonstrate the sensitivity of 3D MAPs to detect abnormalities in these processes, we analyzed Gdf5-null growth plates, a model for the human disease Grebe syndrome7,8, a severe bone growth disorder (Fig 1D). Confocal microcopy of single molecule fluorescent in-situ hybridization (smFISH) (Fig 1C) and immunofluorescence of its downstream effectors Smad 1/5/9 (Fig 1E), revealed surprisingly that GDF5 is expressed throughout the growth plate and in its absence Smad 1/5/9 activity is reduced, suggesting that growth plate activity is abnormal. To integrate these molecular analyses with tissue and cellular scales we performed LSFM and 3D MAPs analysis on Gdf5-null growth plates, revealing several abnormalities in cell growth, shape, and organization, which together provides an explanation for the shortening of Gdf5-null tibias. For example, abnormalities in cell growth mechanisms caused PZ cells to flatten irregulary, leading to round cells which were unable to orient themselves properly (Fig 1F). Additionally, in the PHZ chondrocytes grew at half the normal rate causing the HZ chondrocytes to be 30% smaller than controls (Fig 1F).
LSFM was paramount to uncovering these morphogenetic abnormalities, as its speed permitted us to capture a large tissue at subcellular resolution allowing for 3D morphometric analyses of cells within the growth plate. On the other hand, confocal microscopy was necessary for quantifiable imaging of GDF5 transcripts in the growth plate cells. Joining these two imaging modules together we revealed a new way to study bone growth, through tracking the 3D morphogenesis of growth plate cells and identified GDF5 as a new component in the molecular mechanism which regulates bone growth.
References
1. Kronenberg, H. M. Developmental regulation of the growth plate. Nature 423, 332–336 (2003).
2. Amini, S., Veilleux D. & Villemure, I. Three-dimensional in situ zonal morphology of viable growth plate chondrocytes: a confocal microscopy study. J. Orthop. Res. 29, 710–717 (2011).
3. Cooper, K. L. et al. Multiple phases of chondrocyte enlargement underlie differences in skeletal proportions. Nature 495, 375–378 (2013).
4. Wilsman, N. J., Bernardini, E. S., Leiferman, E., Noonan, K. & Farnum, C. E. Age and pattern of the onset of differential growth among growth plates in rats. J. Orthop. Res.: Off. Publ. Orthop. Res. Soc. 26, 1457–1465 (2008).
5. Li, Y. & Dudley, A. T. Noncanonical frizzled signaling regulates cell polarity of growth plate chondrocytes. Development 136, 1083 (2009).
6. Aszodi, A., Hunziker, E., Brakebusch, C. & Fassler, R. Beta1 integrins regulate chondrocyte rotation, G1 progression, and cytokinesis. Genes Dev. 17, 2465–2479 (2003).
7. Basit, S. et al. A novel insertion mutation in the cartilage-derived morphogenetic protein-1 (CDMP1) gene underlies Grebe-type chondrodysplasia in a consanguineous Pakistani family. BMC Med. Genet. 9, 102–102 (2008).
8. Mikic, B., Rt, C., Battaglia, T. C., Gaschen, V. & Hunziker, E. B. Altered hypertrophic chondrocyte kinetics in GDF-5 deficient murine tibial growth plates. J. Orthop. Res. 22, 552–556 (2004).