Revised phase diagram of PZT for low Ti concentrations: single crystal X-ray study
2CRG / BM01, Swiss-Norwegian Beamlines at ESRF, Grenoble, France
3Laboratory of Neutron Research, The Ioffe Physical-Technical Institute, Saint-Petersburg, Russia
4Faculty of Physics, Southern Federal University, Rostov-on-Don, Russia
Lead zirconate-titanate (PZT) system likely is the most explored among ferroics, but multiple controvercies still exist concerning the phase diagram. That is due to the fact that some regions are underexplored as they are less attractive for the application, but also because the most of studies are made on polycrystalline samples. The polycrystallinity can obscure and/or wash out significant features, hide phase transitions and displace the phase equilibria.
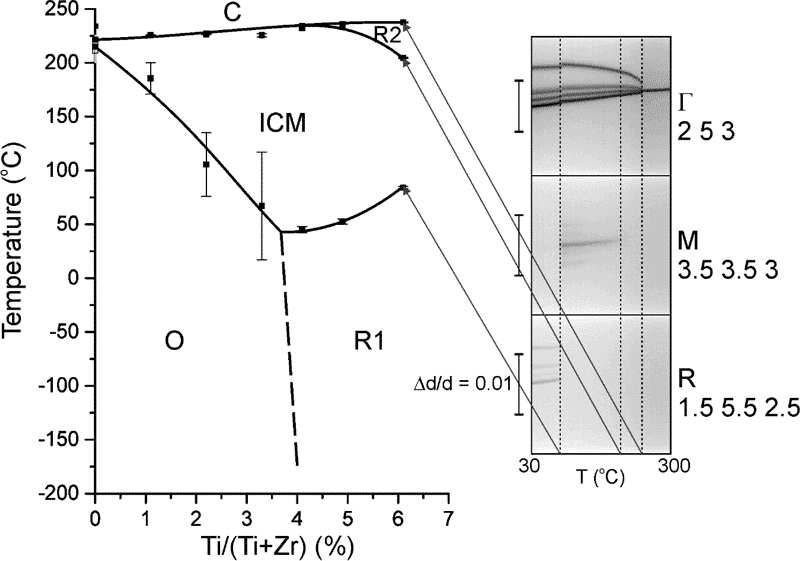
In this work we studied a set of PZT single crystals with Ti content up to ~6% by x-ray diffraction, establishing the new version of phase diagram (Figure 1).
Five phases were identified: O = orthorhombic phase Pbnm, as for pure PbZrO3
R1 = low-temperature phase with superstructure spots in R points – rhombohedral or monoclinic
ICM = incommensurate monoclinic phase – superstructure spots in M points and (1/2±δ 1/2±δ ±δ) points, where d is of the order of 0.01 r.l.u. or less, monotonically changing with temperature.
R2 = high-temperature rhombohedral phase – no superstructure spots, diffuse intensity in M points
C = primitive cubic phase
Rather surprising feature is very large extent of field of incommensurate phase, presumably monoclinic. Symmetry of the phases and nature of transitions between them are discussed.

Figure 1. Phase diagram of PbZr1-xTixO3 for x≤0.061. Solid symbols correspond to the average between cooling and heating transition temperatures, error bars denote the hysteresis. Insets represent the dependence of peak splitting from temperature.
Powered by Eventact EMS
