Background: In addition to imaging of the coronary tree anatomy, cardiac CT angiography (CCTA) may be used as an alternative, non-invasive technique for the assessment of cardiac perfusion.Current analysis of the CCTA 3D myocardial perfusion dataset relies on statistical approaches that classify pixels according to probability values, which are determined based on the intensity distribution of the image. However, other established modalities for perfusion quantitation like SPECT MPI, are based on a different method which is automated comparison with reference of normal database polar maps. Therefore, our aim was to investigate the feasibility of generating normal database reference map for CCTA.
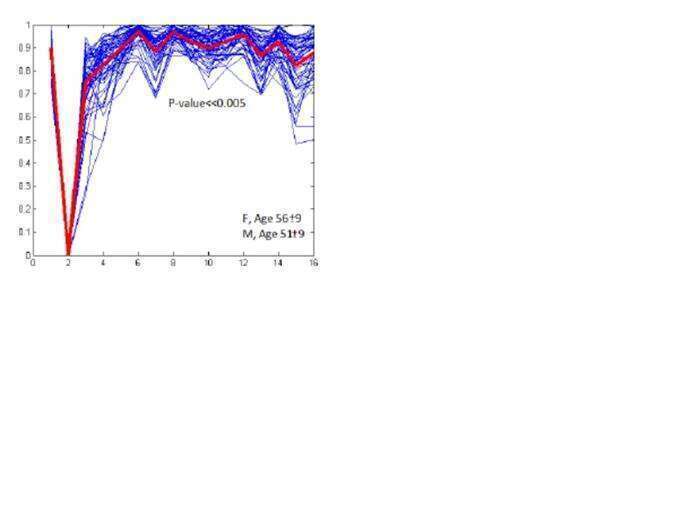
Methods: The database included 60 good quality, spiral CCTA studies (Philips 64-slice Brilliance CT) (30F/30M), with normal coronary arteries, selected from two medical centers. All the studies were automatically analyzed using a dedicated cardiac application - Comprehensive Cardiac Analysis (IntelliSpace Portal 6, Philips Healthcare, Cleveland, OH, USA) to create a 16-segmnet polar map. In the polar map, each segment was assigned with the mean signal intensity (SI) in HU to create a 16 value vector. The vectors were then normalized according to the min-max values. The mean vector was calculated by averaging each segment to create a curve representing the polar map. t-test on each segment was performed.
Results: The figure below demonstrates the normalized values of the 16-value vector. Segment 1, 6, 8, 12 and 14 show the highest SI segments 4, 5, 7,9,10, 11, 13 and 15 show lower SI whereas segments 2 and 3 show the lowest SI. Qualitative observation suggests similarity between the curves.
Conclusion: In a study group of normal coronary arteries on CCTA, there is a typical consistent pattern of SI of perfusion. Our initial results show the feasibility of normal limits method and lay a path for further investigation in various clinical settings.
Conclusion: In a study group of normal coronary arteries on CCTA, there is a typical consistent pattern of SI of perfusion. Our initial results show the feasibility of normal limits method and lay a path for further investigation in various clinical settings.