I. Introduction
The behavior of a blast wave, in which an initial positive overpressure pulse is followed by a negative overpressure phase, have been investigated mainly by field test using such an explosive as trinitrotoluene(TNT)[1-2]. The scaled distance Z, which is a function of charge weight and distance from the blast wave source, characterizes the positive peak overpressure, Δp+; the duration of positive phase, t+; the negative peak pressure, Δp-; and the duration of negative phase, t-. For a small Z, the effect of positive phase dominates because of the high Δp+ value. On the other hand, in the range of large Z, the Δp+ value becomes relatively smaller and the negative pressure phase becomes more important. However, it is difficult to evaluate the effect of the negative phase with high accuracy method because the impulse imparted on an object is sensitive to its size, geometry and location[3-4].
Laser induced breakdown can generate a blast wave in free air. The released energy in such a process is commonly several orders of magnitude lower than that in a field explosion test. Therefore, this method allows the investigation on the blast wave effect on an object with large Z. In this study, we experimentally study the effects of the negative overpressure phase in a pulsed-laser-induced blast wave on the motion of objects.
II. Experimental Apparatus
A pulsed TEA CO2 laser (wave length of 10.6 μm, pulse duration of 2μs) was used to output a pulse with 9.0 J energy to generate a blast wave through electron avalanche. The laser pulse was focused by a plano-convex lens made of zinc selenide (focal length of 300 mm). The laser energy before and after breakdown were measured by an energy meter, which are 7.00±0.10 J and 0.40±0.02 J, respectively. Hence, the absorbed energy is about 6.6 J. The overpressure of the blast wave was measured by a pressure transducer (PCB Piezotraonics, 113A21). The transducer was flush-mounted in an aluminum disk center and faced perpendicular to the laser axis as shown in Figure 1. To reduce the vibration effect of the aluminum disk, the transducer was fabricated in a polyacetal holder. As control parameters, the diameter of the aluminum disk d, and the distance from the breakdown point to the sensor l, were varied. The scaled distance Z ranged from 0.9 to 21.5. A schematic illustration is shown in Figure1.
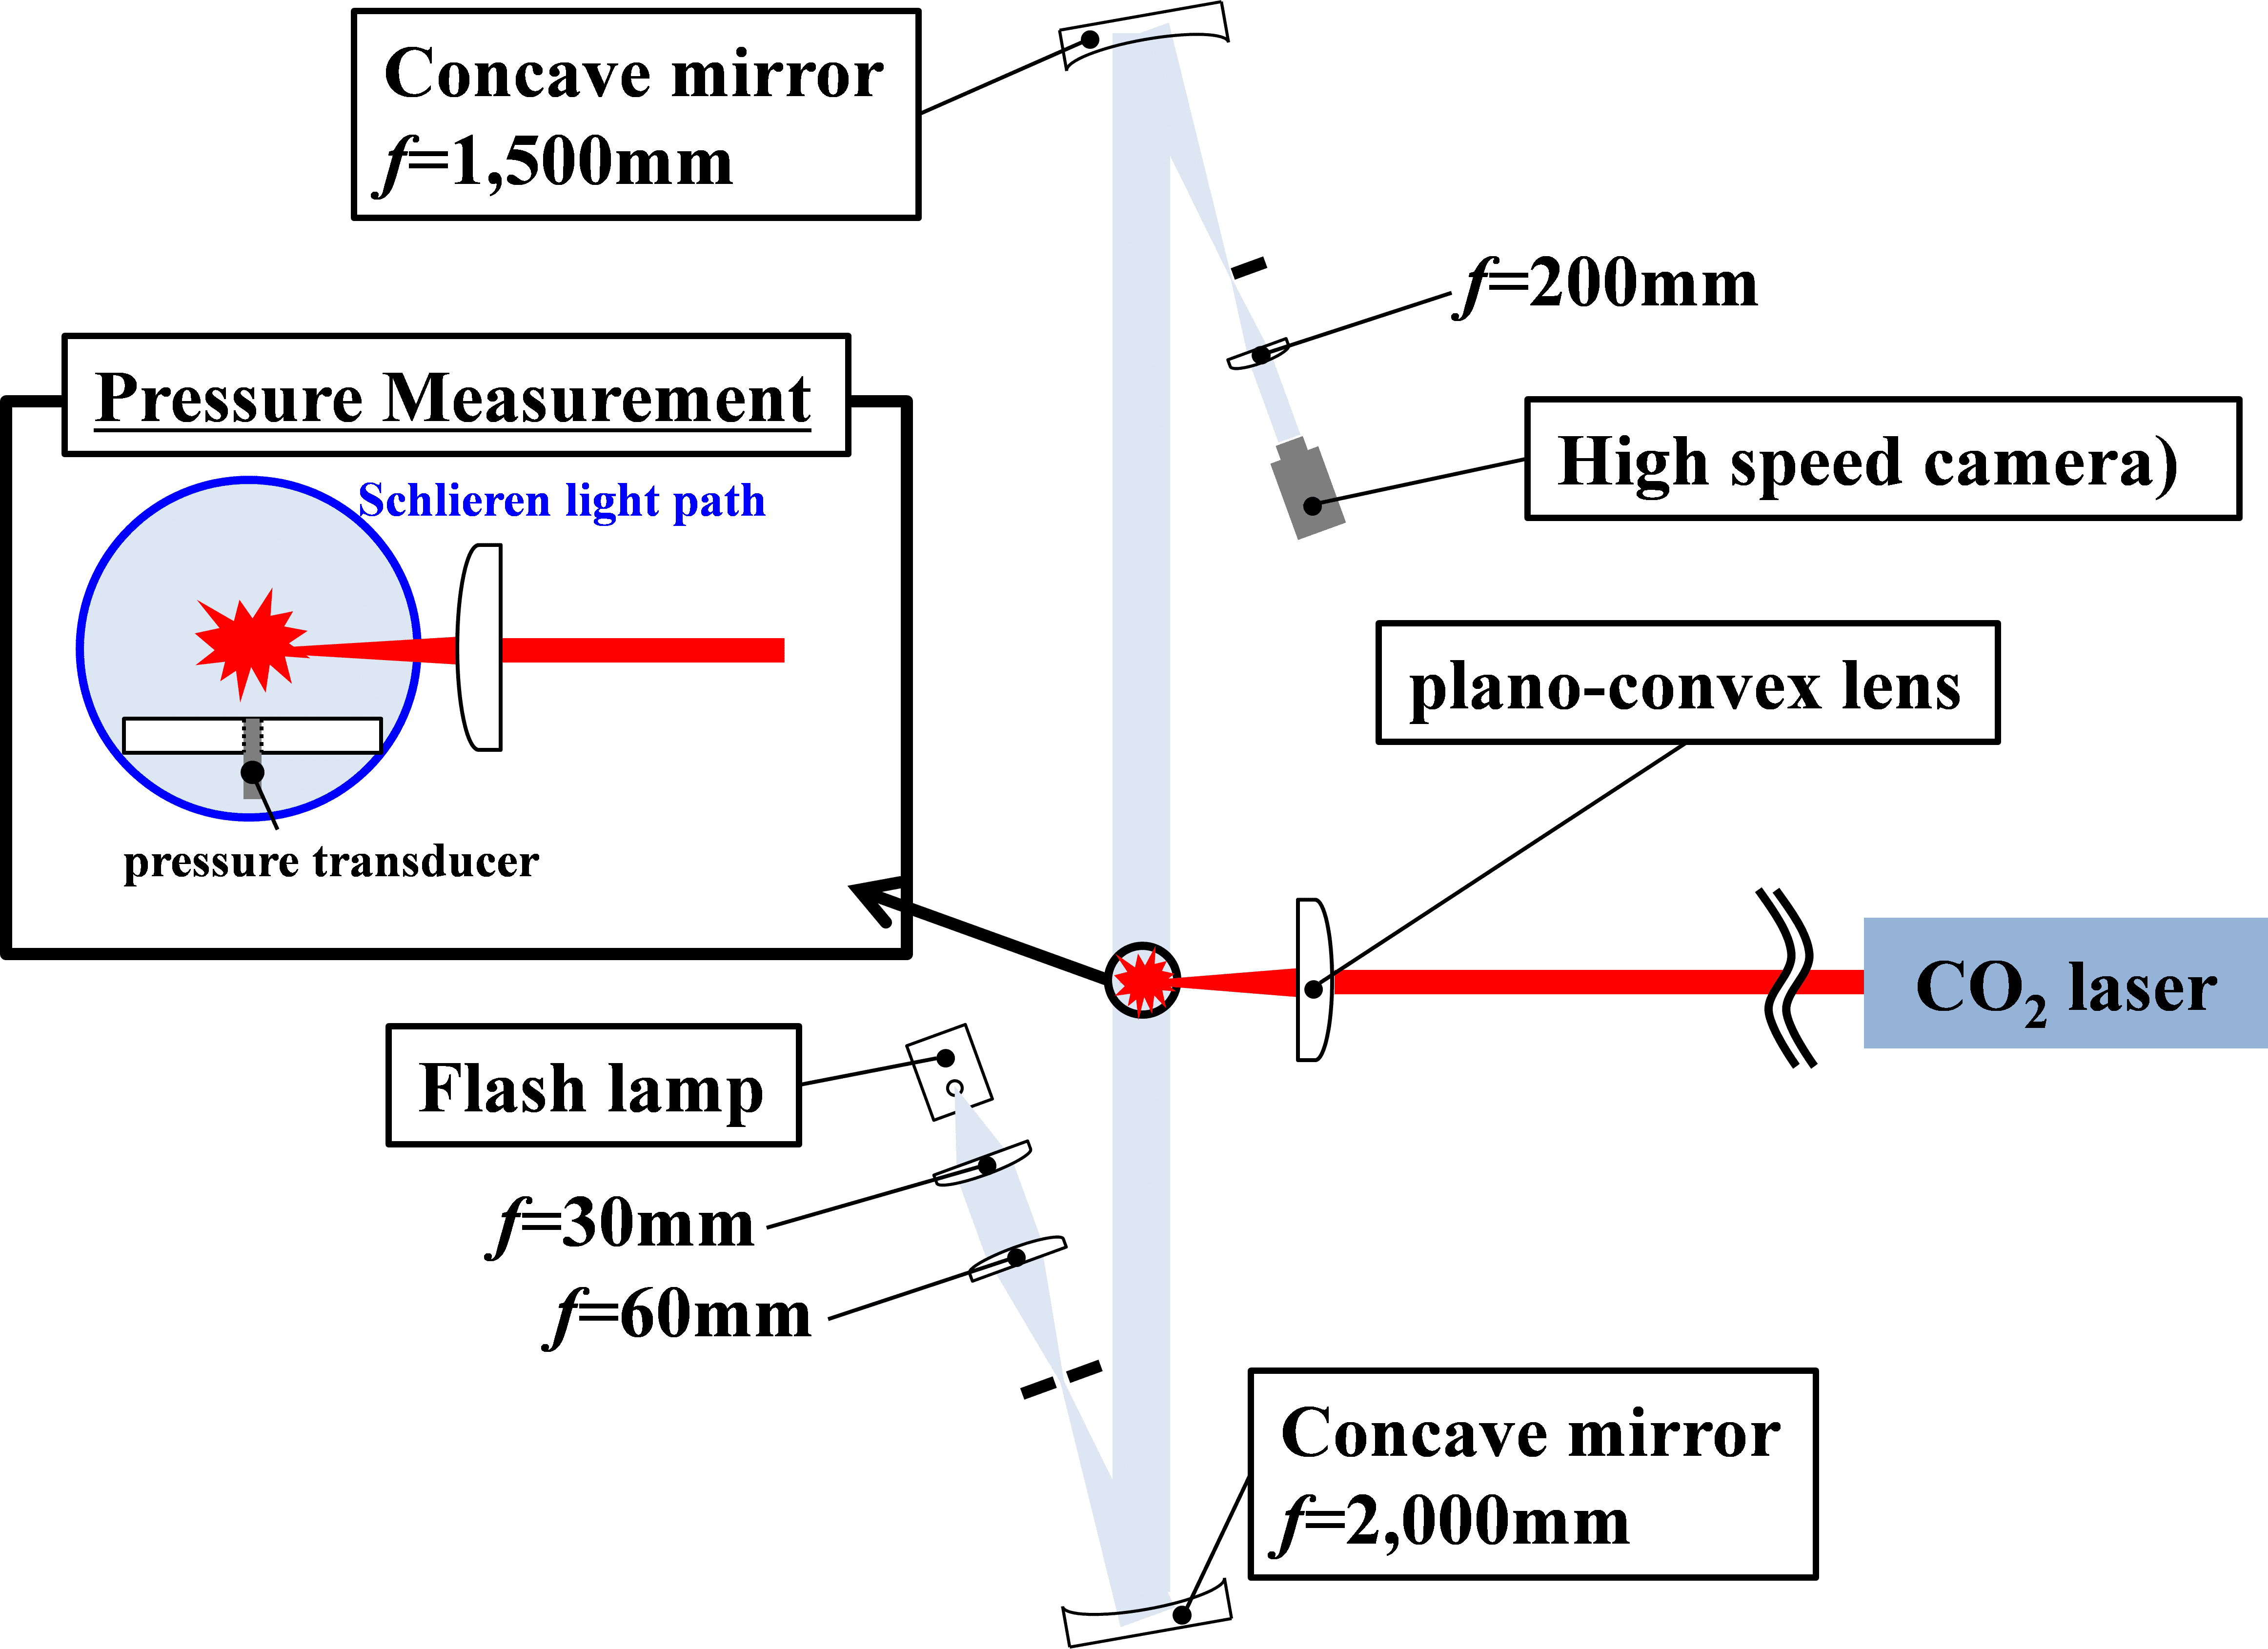
Figure 1. Experimental setup.
III. Results and Discussion
The experimental condition is shown in Table 1. Figures 2 shows the overpressure histories with circular plates of d = 20, 50, 100 mm when l = 75 mm. In this figure, t=0 is the laser pulse irradiation time. The positive peak overpressure does not change with varies d. However, the overpressure history in its negative phase is affected by the value of d. Figure 3 shows the Schlieren images for l = 75mm and d = 50 mm. For Figs. 2 and 3, the positive overpressure peaks corresponds to the arriving time of the blast waves, the first negative overpressure peak is caused by the reflection of the expansion waves behind the leading blast wave, and the second one is caused by the expansion waves propagating from the edge of the disk. The total impulse exerted to the sensor is shown in figure 4. As shown in this figure, the total impulses are all negative (means that its direction is to the blast wave source). The impulse strength decreases with the distance l. Figure 2 and figure 4 show that for each blast wave pressure record, though the positive peak overpressure value is higher than the absolute value of the negative overpressure peak, the duration of the positive phase is shorter than that of the negative one.Therefore, the temporal integrated impulse is dominated by its negative phase rather than the positive phase.
Table 1. Experiental condition.
| d [mm] |
12, 20, 30, 50, 100 |
| l [mm] |
15, 20, 25, 30, 50, 75, 100, 150, 200, 250 |
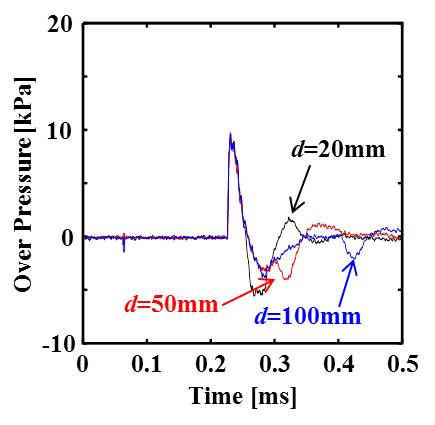
Figure 2. Over pressure history of l = 75 mm.
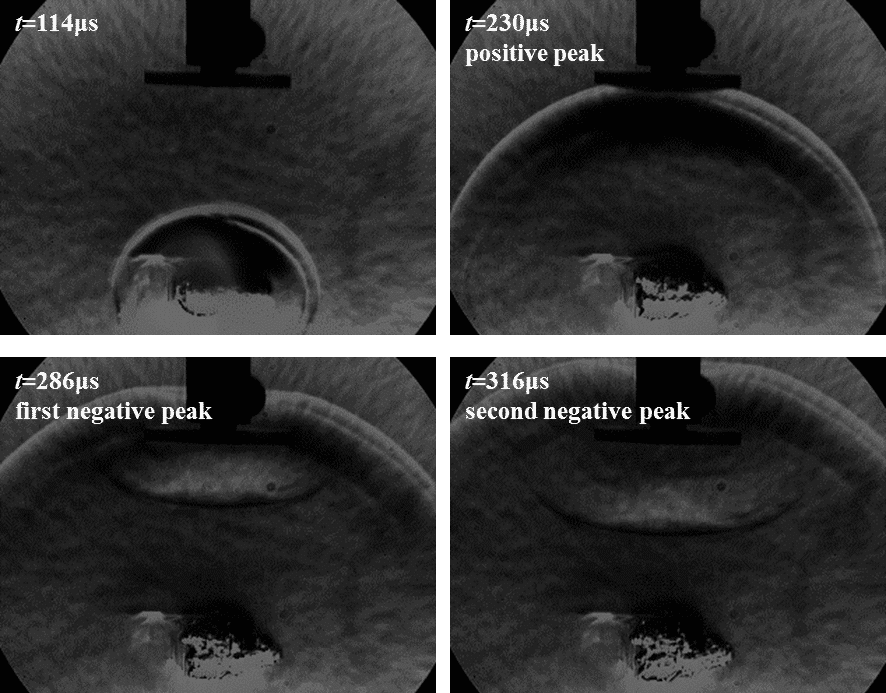
Figure 3. Schlieren images. l = 75 mm, d = 50 mm.
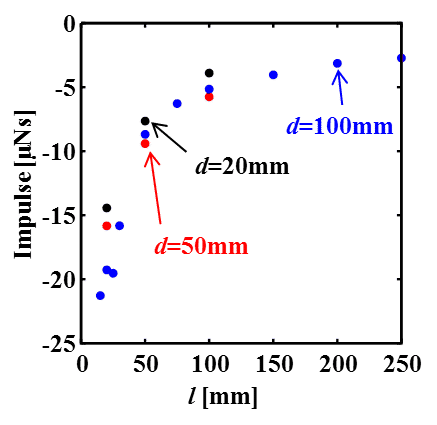
Figure 4. Total impulse vs distance from breakdown point.
IV. Conclusion
The overpressure phases of the blast wave generated by a pulsed laser were investigated. To study the effect of the expansion wave on the impulse it generated, the overpressure history was measured by the pressure transducer flush-mounted on circular disks and faced to the direction perpendicular to the laser axis. The blast waves were visualized by Schlieren method. Although the positive peak overpressure was higher than the negative one, the impulse in the negative phase dominated over the positive phase. Additionally, the duration and the peak pressure of the negative phase depend on the disk diameter. With lager diameter; d, the negative phase duration becomes longer and its peak absolute value decrease.
Reference
[1] Held, M. “Blast Waves in Free Air”, Propellants, Explosives, Pyrotechnics, Vol. 8(1), pp. 1-7, 1983.
[2] Goel, M. D., Matsagar, V. A., Gupta, A. K., and Marburg, S., “An Abridged Review of Blast Wave Parameters”, Defence Science Journal, Vol. 62(5), pp. 300-306, 2012.
[3] Rose, T. A., and Smith, P. D. ”Influence of the principal geometrical parameters of straight city streets on positive and negative phase blast wave impulses”, International Journal of Impact Engineering, Vol. 27(4), pp. 359-376, 2002.
[4]Krauthammer, T., and Altenberg, A. “Negative phase blast effects on glass panels”, International Journal of Impact Engineering, Vol. 24, pp. 1-17, 2000.
