Current shock tube combustion experiments generally assume that the test environment behind a reflected shock wave is quiescent and that ignition processes progress uniformly over the entire test volume. However, various past investigations, mostly based on schlieren data, have observed non-uniform ignition in certain test regimes. Here, we use both conventional diagnostics (pressure, emission, and laser absorption) and a high-speed chemiluminescent imaging system to investigate the ignition behavior of n-heptane/oxygen/argon in shock tubes at long test times (greater than 2 ms), thereby mapping the boundary of uniform and non-uniform ignition.
Ignition delay times from n-heptane/O2/argon experiments conducted in our laboratory are shown in Fig. 1. While there is strong agreement at the highest temperatures and near 700 K, modeling and experiment vary significantly over most of the NTC regime. It is unclear whether these variations are due to deficiencies in the reaction mechanism describing the oxidation of n-heptane or because the assumptions about uniform zero-dimensional chemistry are not justified.
A schematic of the experimental setup including the imaging arrangement through the endwall of the shock tube is shown in Fig. 2. Images of OH* were acquired with a Phantom v710 CMOS camera using a 12 kHz acquisition rate, with a typical resolution of 200 mm per pixel. Conventional OH* emission, and fuel concentration time-history measurement using 3.39 micron HeNe laser absorption were also performed.
Experiments were conducted using both conventional and constrained reaction volume (CRV) fill strategies. Conventional fill experiments fill the entire driven section with test mixtures. CRV fill experiments use the strategy of Hanson et al. which limits the fuel loading in a shock tube to the volume near the end wall of the shock tube. This approach provides near-constant-pressure experimental conditions, as well as avoiding the influence of pre-ignition events at a distance from the end wall. The following figures exhibit key images of two different CRV reflected shock experiments, edited to show relevant details such as time and distance. Additionally, the frames have been artificially colored to assist the viewer in observing details of the image. Finally, these frames are shown adjacent to their corresponding time-dependent graphs for the run, with exact times of each image indicated on the graph to match image data to graph data.
The higher temperature example (1166 K), Fig. 3, experiences sharp detonation-like ignition, as indicated by the rapid increase of the pressure and OH* emission graphs, at 1.28 ms. Previous to that there is evidence of burning, limited to the regions around the circumference, but no sign of emission in the core flow. Until the ignition event at 1.28 ms, the pressure is effectively constant and the burning around the circumference does not appear to affect the measured core ignition delay time. At 1.28 ms, there appears to be effectively uniform homogenous ignition throughout the test volume.
The lower temperature (986 K) case, Fig. 4, by contrast, does not experience a rapid ignition event. The pressure remains near-constant, as expected for CRV-fill experiments. The OH emission rises over a long time interval of 3 ms (5-8 ms) even though the stoichiometry is the same as that of the Figs. 2 and 3 experiments. The ignition event is dominated by early burning in regions growing from the circumference.
Conclusion
It is critically important to identify the combustion regimes that occur in long-test-time ignition delay time experiments. Current detailed reaction mechanism modeling assumes in many cases that these processes are zero-dimensional, and as is evident in this study, this is not accurate under some test conditions. A facility-dependent test-condition map is needed to identify the regimes where more detailed modeling is needed for quantitative combustion kinetics experiments.
This material is based upon work supported by, or in part by, the U. S. Army Research Laboratory and the U. S. Army Research Office under contract/grant number W911NF1310206.
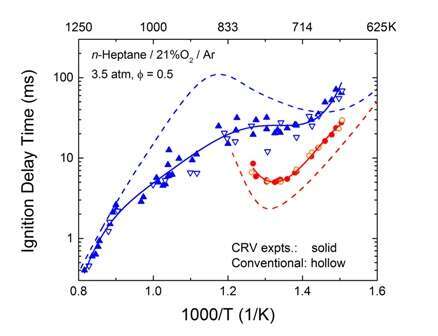
Figure 1. Low pressure ignition delay time measurements in n-heptane/O2/Ar mixtures. Dashed lines: constant-pressure modeling using the Mehl et al. (2011) mechanism.
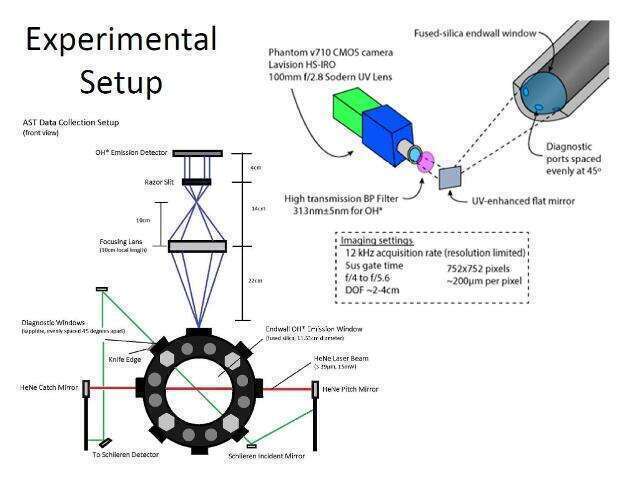
Figure 2. Experimental setup for rapid imaging though the shock tube endwall.
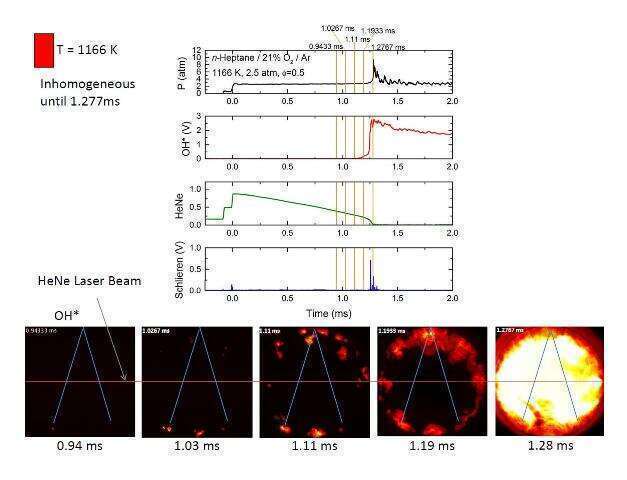
Figure 3. 1166 K ignition delay experiment.
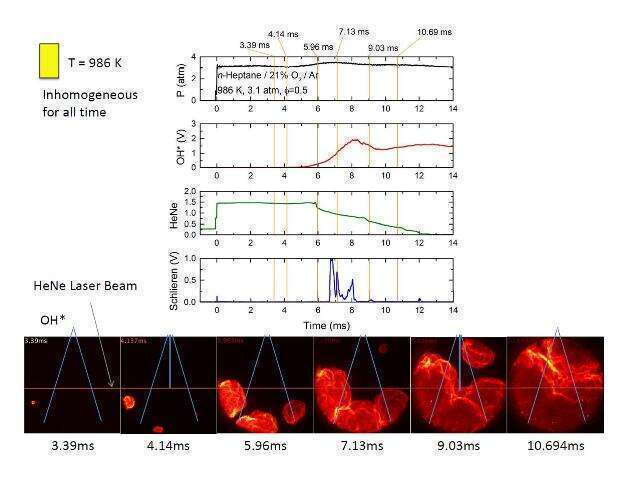
Figure 4. 986 K ignition delay experiment.
