The paper presents results of PIV imaging of the flows originating in shock tube channel, which has rectangular cross-section with dimensions 48×24 mm. A double-frame LaVision PIV imaging system was used with the Litron dual laser (532 nm) as a light source, pulse energy was 180 mJ.
The gas flow is initiated after rupture of a mylar diaphragm dividing the low-pressure and high-pressure chambers. Mach number of propagating shock waves formed varied at M=1.4 – 2.0, yielding flow Reynolds number up to 105 (directly behind the propagating shock front).
PIV analysis of shock wave emanating from open-ended shock tube had been done in atmospheric pressure [1].
PIV observed a 100 mm long part of the channel at 230 cm downstream from the diaphragm. The laser sheet was vertical, directed at an angle of ≈25° to the axis of the tube. DEHS aerosol was used as tracer particles; the tube channel was seeded before each run. The PIV system was triggered by a piezoelectric pressure sensor located inside the low pressure section close to the observation section. Analysis of velocity data near the front of flat shock waves at different pressures (from 760 to 100 torr) provided a valuable experimental data for verification of the particle-flow interaction theories. Comparison of experimental velocity profiles captured on the shock front (Fig. 1a), with calculated profiles allowed to measure tracking characteristics of tracer particles [2].
 |
 |
| a |
b |
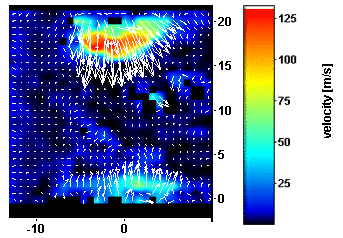
Fig.1 Velocity field at the front of a propagating flat shock wave (a) and blast wave from surface discharge (b).
Also, PIV with TiO2 solid tracers was used to study the high speed flow field created by pulse sliding surface discharges, initiated on the walls of the tube channel, in air under low pressure. High current nanosecond discharge initiates blast wave propagating from the surface and several other less energetic flow patterns [3]. The visualized flow includes blast waves (Fig. 1b) and thermal plumes.
High-speed shadowgraph system with capture rate up to 500 000 fps was also employed to provide data on evolution of investigated flows.
[1] Glazyrin F.N., Mursenkova I.V., Znamenskaya I.A. Particle image velocimetry study of the shock wave emanating from open-ended shock tube. Visualization of Mechanical Processes, 2 (4). 2012.
[2] Tedeschi, G., Gouin, H., and Elena, M. Motion of tracer particles in supersonic flows. Exp. Fluids 26 (4), pp.288–296. 1999.
[3] Bazhenova T.V., Znamenskaya I.A., Lutsky A.E., Mursenkova I.V. An Investigation of Surface Energy Input to Gas during Initiation of a Nanosecond Distributed Surface Discharge. High Temperature, Maik Nauka/Interperiodica Publishing, 45 (4), pp. 523-530. 2007.
