Turbulence diagnostics in flows with shocks
by digital BOS, Speckle and Talbot techniques
N.А. Fomin1,2, O.G. Penyazkov1
1A.V. Luikov Heat and Mass Transfer Institute of National Academy of Sciences of Belarus, Minsk, 220072, Belarus
2Department of Mechanical Engineering, Zhejiang University, Hangzhou, 310027, China
Modern optical techniques based on computer-aided image pattern analysis extends the methods of flow visualization and diagnostics and allows the quantitative derivation of a two dimensional map of deflection angles experienced by light passing through a flowfield under study. Such line-in-sight diagnostics with the use of digital images analyses becomes especially attractive when turning to the statistical analysis of the complex flow pattern in turbulent flows with shock waves [1, 2].
In present paper three optical line-in-sight methods, namely, (1), Background Oriented Schlieren (BOS), (2), Laser Speckle Photography (LSP), and (3), Talbot interferometry (TI) have been applied to on-line turbulence structure monitoring.
It has been shown that digital versions of BOS, LSP, and TI are effective methods for monitoring and quantitative visualization of temporal and spatial changes in the correlation scales of turbulent media variations. Abel, Radon and Erbeck-Merzkirch integral transforms have been used for local microstructure scales evaluation [3, 4]. The use of Erbeck-Merzkirch integral transform allows to perform tomography reconstruction and to determine 2D maps of micro- and macroscales of turbulence.
The results obtained point to a high spatial and temporal resolution of the methods and to the possibility of real-time operation mode realization. It has been shown that noise filtering is an important part of the images processing. Sensitivity, temporal and spatial resolution of these three methods are analysed and compared.
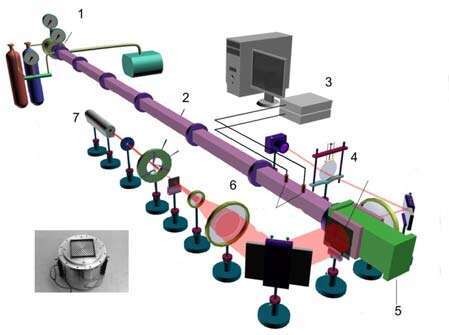
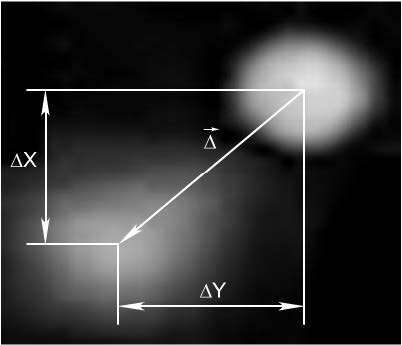
Fig.1. On the left: shock tube of Luikov Heat and Mass Transfer Institute. On the right corner, turbulence grid, connected with high pressure volume. 1 – high pressure volume, 2 – low pressure volume, 3 – oscilloscopes, 4 – grid image, 5 – test section, 6 – collimator, 7 – laser. On the right: Talbot greed node displacement due to refraction and broadening due to effects of turbulence.
While the PIV records 2D velocity maps within the selected flow sections (planes), BOS, SP, and TI provides an integrated information about the whole 3D flow field. The integration is the same as in the all line-of-sight flow visualisation technique. The flow visualisation data allows, in principle, reconstructing interior flow structures, but the reconstruction procedures are rather complicated. Such procedures are called computer-assisted tomography (CAT), optical tomographic reconstruction, or computerised tomography (CT) [2]. From a mathematical point of view such procedures are ill-posed problems, and a big amount of precise quantitative information about the flow obtained from multi-projectional measurements with high precision of experimental data extraction and high spatial resolution are needed for successful reconstruction of a 3D flow structure.
For fluid mechanical measurements CT was introduced as a technique that allows one to determine temperature, density, or concentration profiles in 3D flows by means of multi-projectional interferometric measurements [1]. A number of other flow diagnostic techniques, including absorption, emission, and holographic interferometry, have been combined with CT, see [2].
Principles for measuring the light deflection angles by means of SP, BOS, and TI have been described earlier[4] and are illustrated in Fig. 1. An expanded parallel beam of laser light is transmitted through the test media. A lens 6 focuses a plane in the test section onto a grid. It could be ground glass plate or Talbot grid. The second imaging lens focuses a plane at a distance d from the ground glass onto the photographic plate. On this plate a speckle pattern is recorded that is existent in the plane at a small distance d from the ground glass plate. In double exposure speckle photography, (DESP), two speckle patterns are superimposed by recording two exposures on the same digital image. The obtained specklegram is digitally interrogated by cross-correlation analysis. The results are two components of the speckle displacement at each specklegram interrogation point. These values can be easily converted into the components of the deflection angle of the light passed through the flow studied.
Thus, both macro and micro spatial structures of the turbulent scalar (density) field in compressible flow can be visualized and quantitatively characterised with the applied holographic and speckle tomography techniques. The macro structures are reconstructed using direct numerical simulation of flow patterns and comparison with holographic interferometry data and by using CAT with Radon integral transform. The microscale turbulence structures are determined by using the 3-D density correlation functions evaluated with Erbeck-Merzkirch integral transforms.
References
- Merzkirch W. (1987): Flow visualization. 2nd edition, Academic Press, Orlando.
- Fomin N. (1998): Speckle photography for fluid mechanics measurements. Springer, Berlin.
- Fomin N., et al. Shock Waves, 10, 2000, p. 345.
- Fomin N., Penyazkov O. et al. Proc. of the 8th International Conference on Methods of Aerophysical Research, Novosibirsk, Russia (2007).
