The non-ideal flow in a shock tube has been an important area of gas dynamic research as early as the mid-nineteenth century when the effects of the boundary layer behind the shock wave were investigated [1]. The attenuation of the shock front and the acceleration of the contact surface lead to a reduction in test time in a shock tube [2]. The deviations from the ideal shock tube flow scenario are not only attributed to the shear stresses but also to the heat loss behind the unsteady shock front and the non-instantaneous nature of the diaphragm rupture. As the diameter of the shock tube is reduced, the shock wave attenuation is more rapid. With the changing landscape of shock wave research, micro-shock waves have found applications in biological sciences [3]. With the development of devices for such applications, it is essential to understand flow through small-scale shock tubes. A recent work on micro-scale shock tube flow introduced a scaling parameter, ReD/L [4]. This shows that the viscous effects become dominant at low initial driven section pressures and also if the diameter of the shock tube is reduced. The effect of low initial driven section pressures has been demonstrated in a 5.3mm shock tube. But there is no work available in open literature to find the role played by the diameter of the shock tubes to the best of our knowledge. In this present work, we have designed an experimental setup in which the cross section of the entire shock tube can be varied. Provisions have been made to perform both visualization and pressure measurements in the different diameter shock tubes.
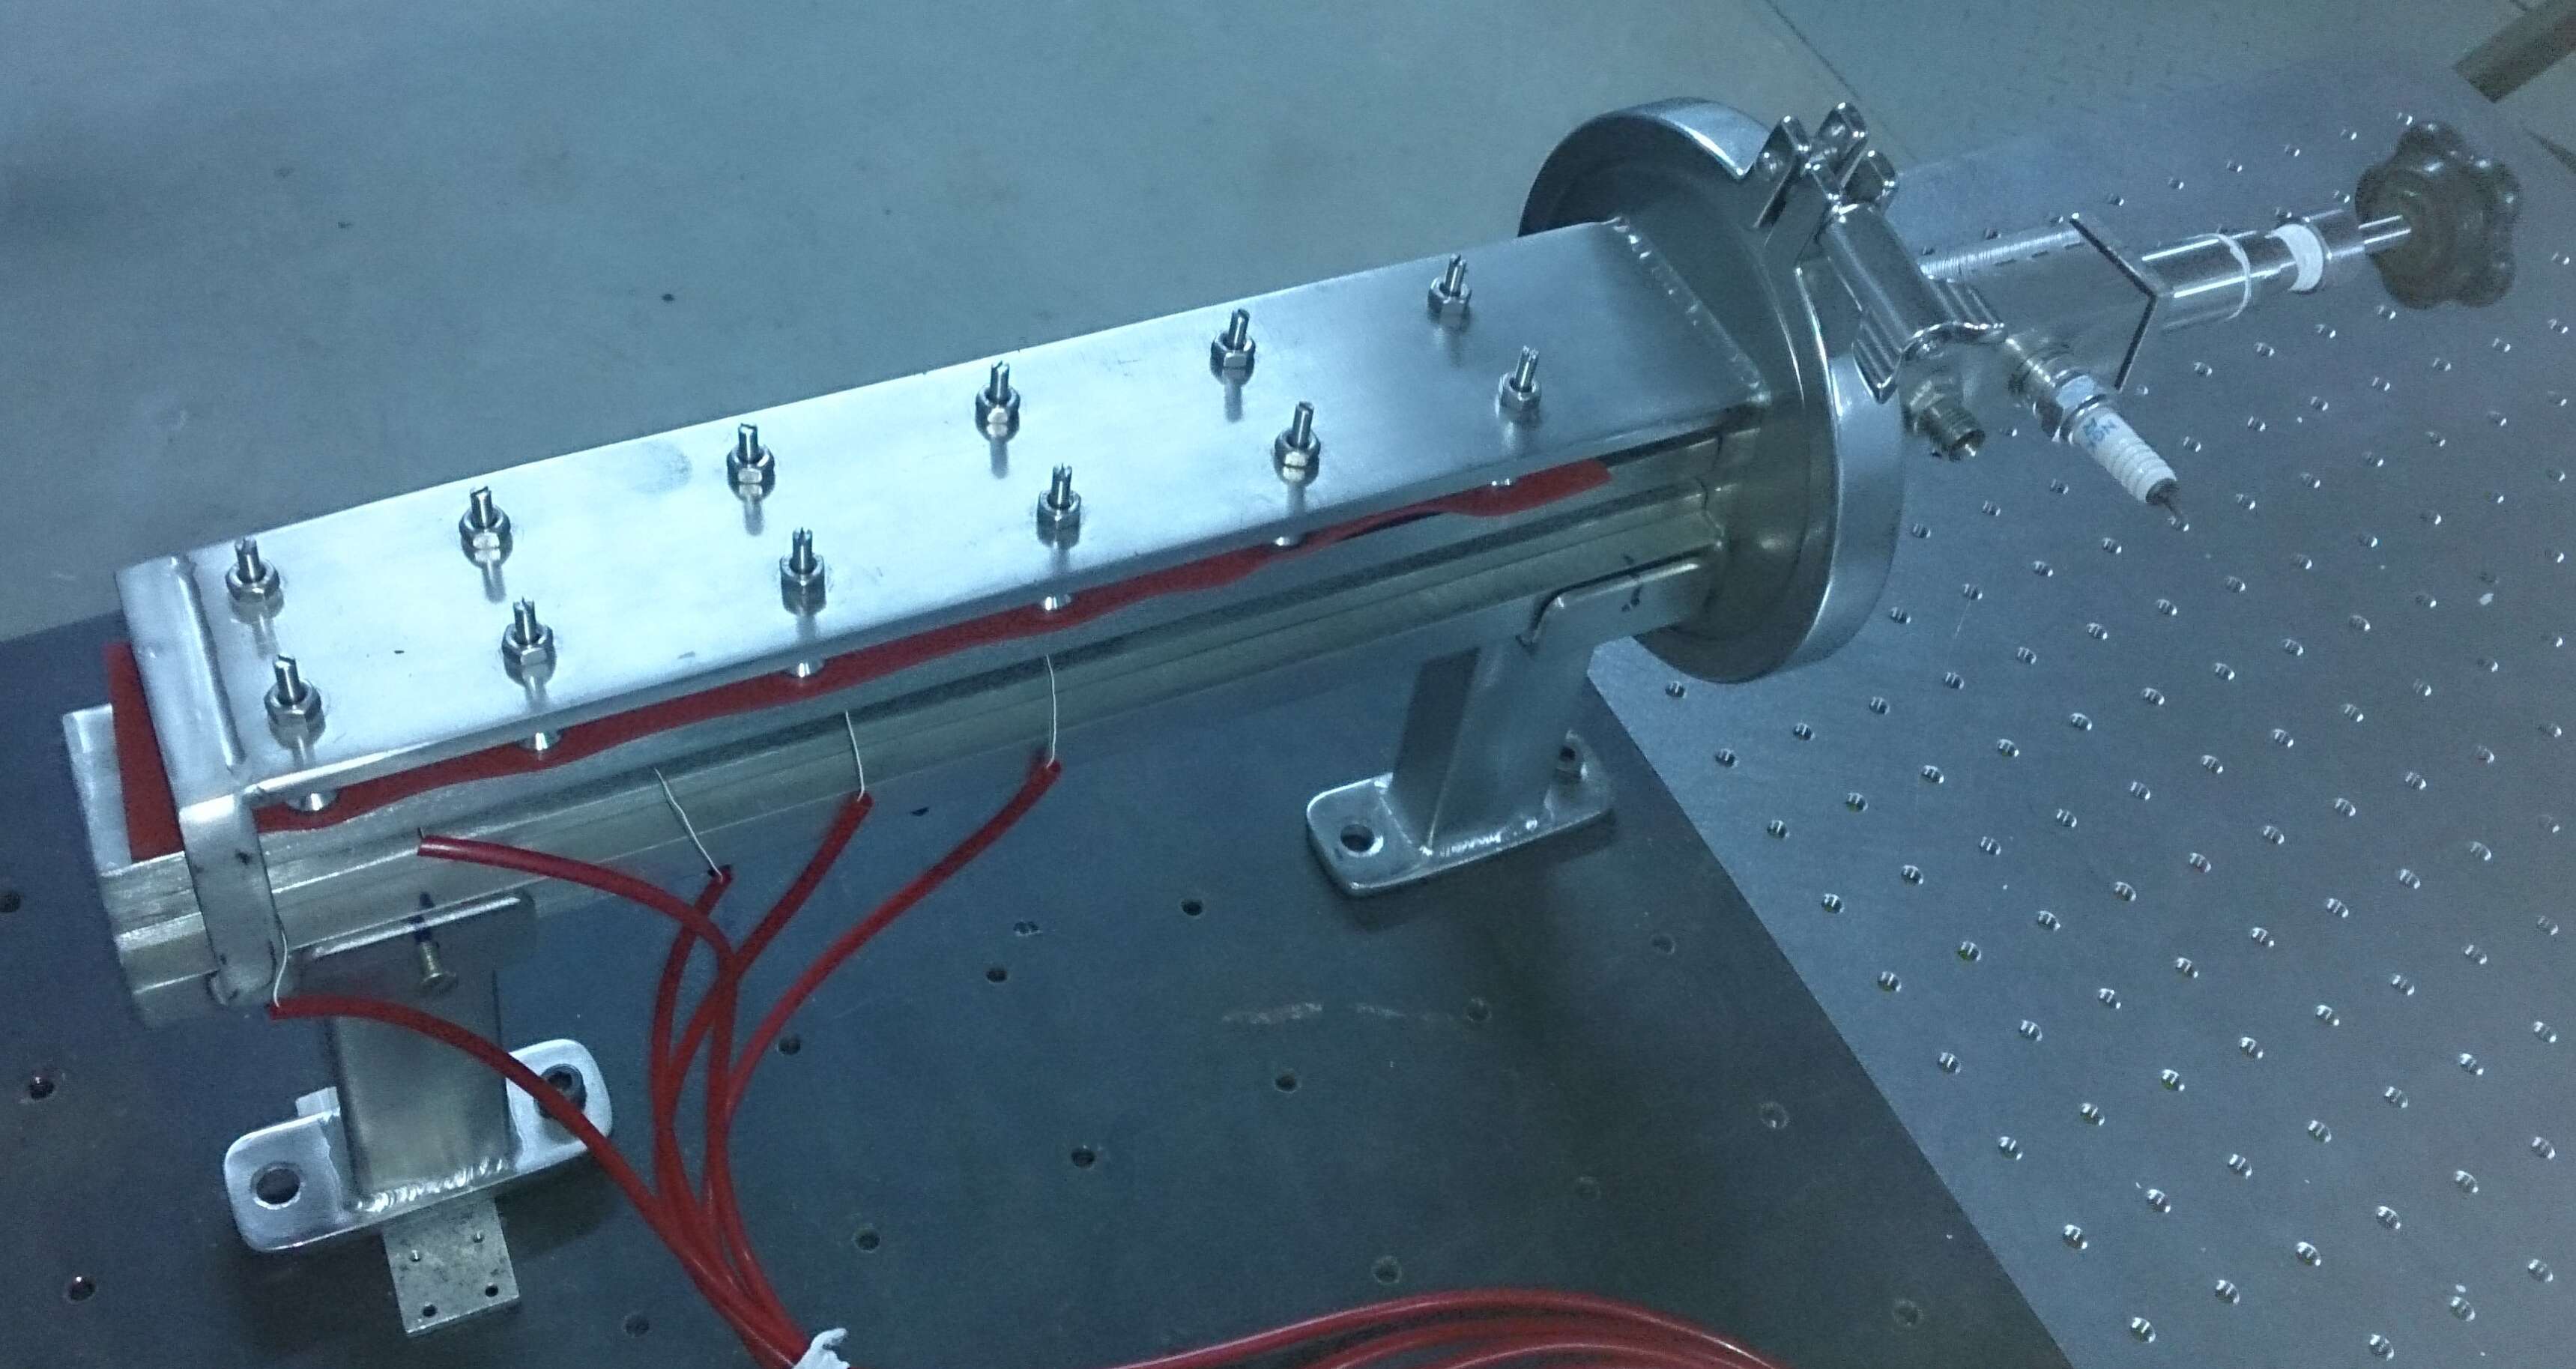
Square cross section shock tubes of dimensions 2mm, 6mm and 10mm are used. The driver section and the driven sections lengths are maintained as 100mm and 300mm respectively. The diaphragm pressure ratio is maintained as 15 for all the experimental cases. A mechanism to puncture the cellophane diaphragm is employed to maintain the same rupture pressure for all experiments. A photograph of the setup has been shown in figure 1. Visualizations studies using a conventional shadowgraph technique is made as well as pressure measurements at the end of the shock tubes. Visualization studies have been performed using a high speed camera (Phantom V310, Ms Vision Research, USA) and an LED light source. Pressure measurements are made using ultra miniature thin line pressure transducers (Kulite Semiconductor Products, Inc. USA).
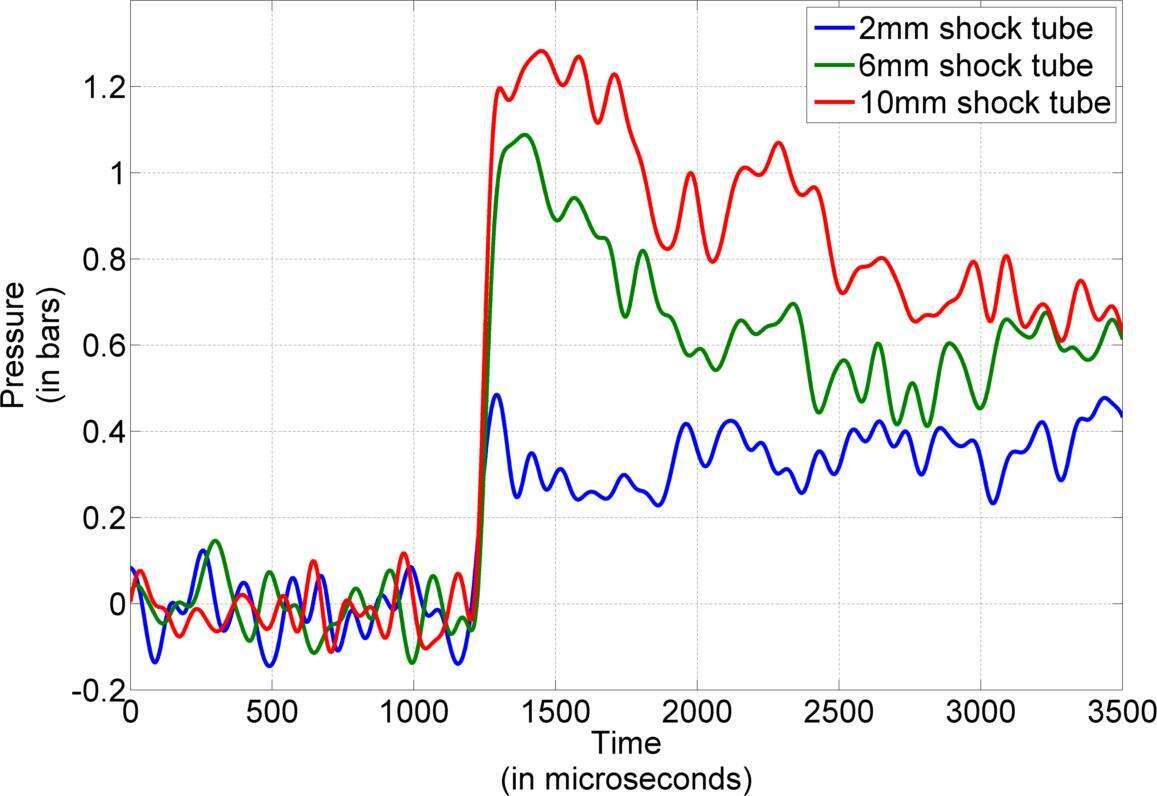
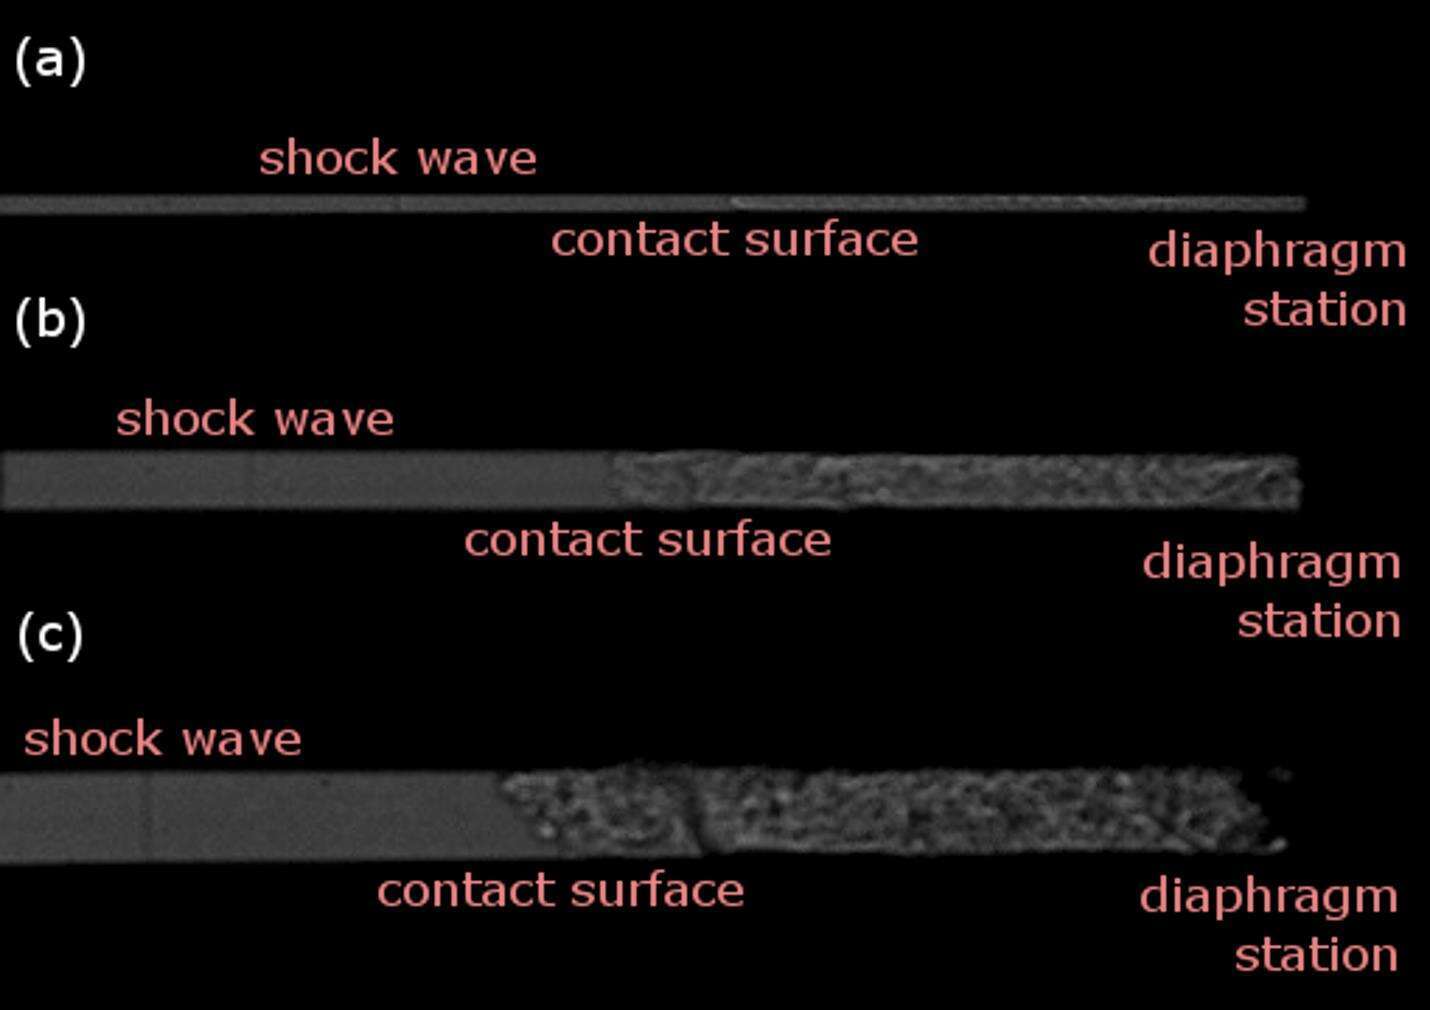
The shock pressure measured at the end of the shock tubes have been plotted in figure 2. This plot clearly shows the attenuation of the shock wave strength with the decrease in the diameter of the shock tube. The high speed images of the flow inside driven section of the shock tubes have been shown in figure 3. The images shown in figure 3 are at the same timestamp after the diaphragm burst. The position of the shock wave indicates the attenuation in shock speed. The trajectory of the shock wave is obtained using an edge detection algorithm in MATLAB. Figure 4 shows the comparison of the trajectories for the different shock tube diameters. Up to a distance of 40mm along the driven section of the shock tube, the trajectories overlap each other. Beyond 40mm, the deviation in trajectories for the different diameters starts to show. This could be a region where the viscous effects start playing a role. We plan to visualize this region more closely in order to obtain any information on the nature of the boundary layer. Similar to the tracking of the shock wave position, trajectories will be obtained for the contact surface also. The visualization of the region close to the diaphragm will give insight into the effect of shock formation distance for the different diameter shock tubes. The one dimensional model proposed for micro-shock flow will be used to check if it predicts the effects of diameter [5]. Details of the complete study will be presented in the full paper.
References:
- “Attenuation in the shock tube”, Emrich R. J. and Curtis C. W., Journal of Applied Physics, 24(3), 360-363 (1953)
- “Attenuation in a shock tube due to unsteady boundary layer action”, Mirels H., NACA TN 3278 (1956)
- “Novel applications of micro-shock waves in biological sciences”, G. Jagadeesh, K. Takayama, Indian Inst. Sci. 1–10 (2002)
- “Shock waves at microscales”, Brouillette M., Shock waves, 13, 3-12 (2003)
- “One-dimensional model for microscale shock tube flow”, Mirshekari G., Brouillette M., Shock waves, 19, 25-38 (2009)