We present the results of experiments aimed at visualizing shock attenuation in sub-millimeter scale channels. The shock waves are produced in a conventional size shock tube with a section of 8 mm x 8 mm to which a 1 mm x 0.5 mm glass microchannel, 100 mm long, is connected. The shock wave is initiated in the shock tube and eventually propagates into the microchannel. Because the microchannel is transparent, a schlieren flow visualization system, equipped with a high-speed video camera, allows for the direct time-resolved observation of the flow. Nitrogen and sulphur hexafluoride are used as test gases, to modulate the strength of the incoming shock for a fixed driver gas pressure and composition, and also to modify the sensitivity of the schlieren system owing to differences in index of refraction between these two gases.
Filming shock wave propagation in such a small channel poses special challenges. At typical shock velocities of 1000 m/s, the shock travels 1 mm, which is the channel height, in one microsecond. To freeze the shock position, a sub-microsecond exposure is required, which stresses the lighting requirements. At the same time, increasing the framing rate in the hundreds of thousands frames per second reduces the available camera resolution, which limits the length of channel that can be imaged. Therefore, serious compromises have to be made to be able to observe the shock and get the position vs. time data to quantify attenuation.
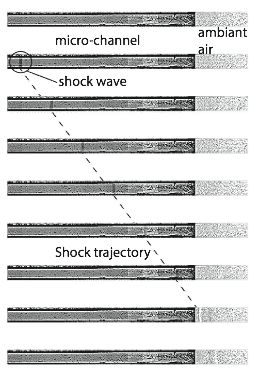
For example, Figure 1 shows a series of images of a shock wave propagating from left to right in the region near the end of the microchannel, which in this run is open to the atmosphere. Measuring the shock position as a function of time allows for the determination of the instantaneous shock velocity and the quantification of shock attenuation due to boundary layer effects. For some fluid flow conditions, the visualization is not good enough to directly locate the shock wave with good accuracy, and this requires video post-treatment and analysis to better observe the peak level associated with the shock wave, and thus to estimate its velocity.
Figure 1. Schlieren images for the propagation of a shock wave into the glass microchannel.
Nitrogen test gas, framing rate 300000 images/s.
The microchannel height is 1 mm.
The shock velocity is between 700 and 750 m/s.
The paper presents a wide variety of results obtained at various incoming Mach numbers and test gases. The measured shock wave attenuation is then compared to various shock tube boundary layer models to assess their applicability.