In the supersonic and hypersonic flow diagnositcs, density field observation has been one of the main targets of experimental fluid-dynamic researchers. From the very beginning of 20th century, flow visualization by optical photographs has been investigated, and the pictures by shadowgraph, schlieren method, or interferometry have been widely utilized to the qualitative density flow field clarification. As these methods still give strong power to the researchers of fluid dynamics, new diagnostic technology has developed along with digital image instruments and high-power PC. Computed Tomography (CT) of the supersonic density flow field including the shock waves is typical and rapid-developing diagnostics with digital image technology. The hardware and software/algorithm for optical CT suitable to the high-speed flows should be investigated in next decade. In the present paper the author would like to introduce the time-developing three-dimensional CT measurement by two optical diagnositcs. One is traditional Mach-Zehnder interferometry, and the other is background oriented shclieren (BOS) method, both of them the high-speed cameras are applied.
First, in our laboratory three-dimensional (3D) and unsteady flow field including shock waves and vortices has been investigated by laser interferometric computed tomography (LICT) measurement by the M-Z interferometry. However, it is still difficult to measure 3D density distribution of the different instants of time in CT reconstruction technique (4D-CT) by single-frame cameras. So to realize the time-developing 3D-CT measurements, a high-speed camera of framing rate of 700,000 is applied to the LICT measurement. This is because continuous framing images can be obtained by high-speed camera even for our shock-tube based iterative multi-shots CT operation. The multi-dimensional and quantitative density measurements have been performed on unsteady, compressible, and interacting shock-vortex flow field induced by the discharging shock wave and jets. Quantitative characterisitcs of the 4D (time scale + 3D) complicated shock-vortex flow are discussed together with the 2D or 3D downgraded and integrated image analysis.
In this LICT method for shock wave experiment we need multidirectional projection data to reproduce the unsteady flow. We use a diaphragmless shock tube to generate the shock waves of high reproducibility. As shown in Fig.1, optical system consists of a high-speed camera, a Mach-Zehnder interferometer, an argon ion laser as a light source. Shock wave generated by the diaphragmless shock tube passes through a rotating plug set at the end of the tube, and the shock-vortex flow discharges into the test section from two inclined and cylindrical (i.d. 3mm) holes. The specs. of the high-speed camera are indicated in Table 1.
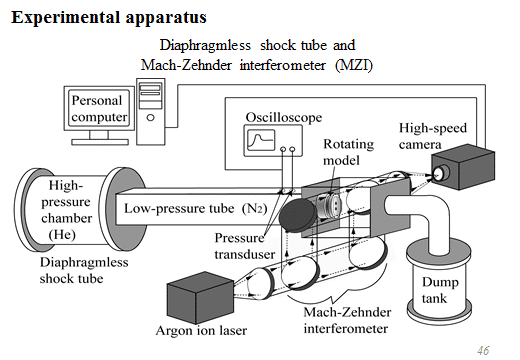
Fig. 1 Experimental setup for time-developing LICT with high-speed camera

By using these setup instruments we can obtain, for example, 39 images of finite fringe interferogram from different angles to have the reconstruction of CT density by ART at one instance. Then the time-developing huge images constructed by each-time 3D CT sets could be obtained by using the high-speed camera with angular rotation of the model. Algebraic reconstruction technique (ART) is much more suitable than FBP’s for our optical CT, as we have been suffering by strong artefacts by data lacking by the model existence. The reduced sizes of each images were used, in reality, to our CT reconstruction, as the power of PC was not sufficient. However, the obtained results are very satisfactory as shown in Figs.3 & 4, because these obtained data were, of course,
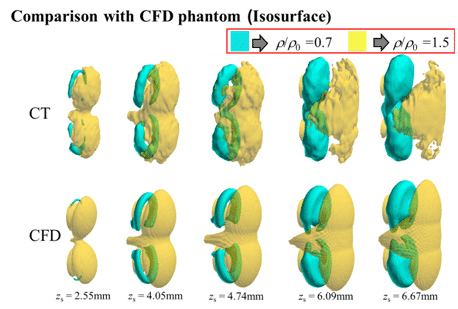
Fig.3 Direct comparison of time-developing 3D-CT results for isopicnic surfaces
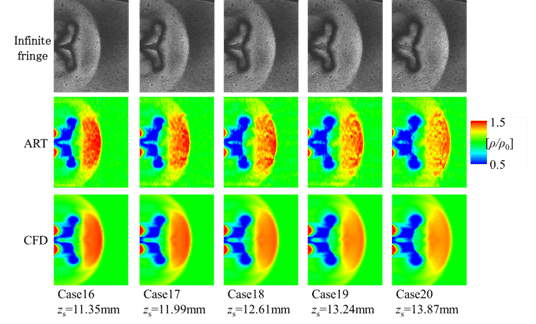
Fig.4 Direct comparison of measured unsteady emerging shock-vortex flow to CFD
quantitative ones, and capable to compare directly to the 4D CFD results. We can discuss the experimental results with direct comparison to CFD and have error estimation on time-developing 3D shock-vortex behavior. It is, of course, a kind of problem to perform these iterative and rotational experiments for the time-depending unsteady shock-vortex phenomena, but if we can have enough number of high-speed cameras, the problem can be solved without any difficulty.
Secondly, in this paper a background oriented schlieren (BOS) experiment is presented by colored-grid (CG) which has been developed by the authors. The interaction of the discharging jet with supersonic flow in JAXA-ISAS wind tunnel was measured by colored-grid CGBOS method with multidirectional projections. The observed 3D density flow field is discussed. The setup for 4D-BOS-CT experiment at JAXA-ISAS supersonic wind tunnel is shown in Fig.5, where the high-speed camera of 1000fps was used to have the set of BOS images for unsteady interaction of injected jet and M=3 supersonic flow.
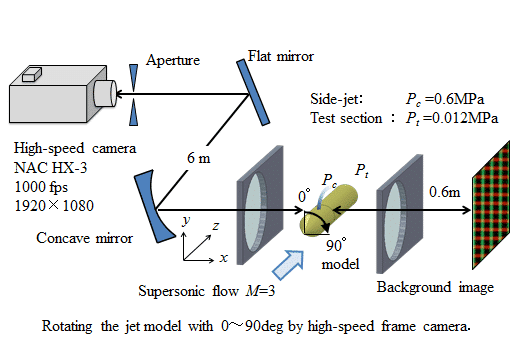
Fig.5 Experimental setup for CGBOS with high-speed camera on 4D-CT
Among the series of framing data at designated time instance by rotating the jet-emerging model, we can select the suitable set of 3D-CGBOS-CT images on density gradient by separating the colored grid to the red and green (horizontal and vertical) stripe-shift. By these digital image data the CT results for the jet-supersonic flow interaction with different time instance can be obtained. Among the results, 3D-CT results-set for an instance can be indicated in Fig.6 & 7. Figure 6 is the displacement of
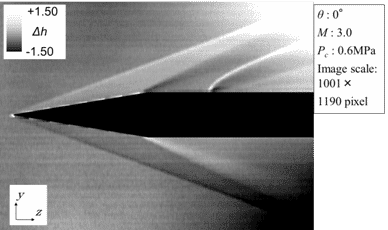
Fig.6 Displacement BOS image data at quasi-steady time on jet-flow interaction in M=3
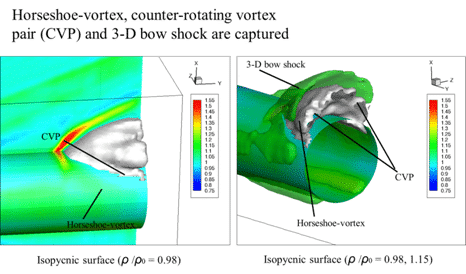
Fig.7 CT-3D density field of jet-flow interaction after integration of density gradient
from horizontal BOS strips. This image can be grouped together with other images to have the BOS-CT reconstruction on density gradient or integrated density field at designated instance. Time-developing 3D CGBOS-CT results were obtained by these data processing.
These experiments were realized by large-scale computer calculation, which are still under development. For example, the 39 multidirectional images of 2000x3000pixels have been utilized to analyze the 3D density or density gradient reconstruction. Furthermore, to obtain the unsteady 4D results, we have performed over 80 different time-scale 3D reconstructions. The experience indicates the new development of large-scale computer-aided experimental mechanics (LSCAEM) based on the quantitative and experimental image analysis.
