A series of numerical simulations of detonation propagating with losses in charges were conducted to study the effect of the acoustic impedance of confinements. The detonation was initialized as a one-dimensional ZND-type wave propagating at the ideal CJ detonation velocity, and was then allowed to propagate into a layer of finite thickness (in two-dimensional simulations) or a cylinder of finite diameter (in axisymmetric simulations) bounded by an inert medium. The yielding confinement of the inert layer resulted in the detonation wave decaying to a sub-CJ steady state velocity or failing entirely. For simplicity, an ideal gas equation of state was used with a pressure-dependent reaction rate that resulted in a stable detonation wave structure.
Simulations were performed with different values of the reaction rate pressure exponent (n = 2 and 3) and different impedance confinement (greater than, less than, and equal to that of the explosive). The impedance of the confinement was varied by inversely changing the temperature and density of the confinement while maintaining the pressure as constant. Currently, the density of the confinement was varied from 0.5 to 10 times of the initial density of explosive.
The structures of steady detonation waves obtained in two-dimensional (planar) numerical simulations demonstrated that with the confinement of equal impedance of explosive and the low impedance confinement, the sonic surface has a lens-like shape attaching to the shock/confinement point; while for the case of high impedance confinement, the sonic surface is no longer attached to the shock front at the point where the shock impinges upon the confinement as predicted by a simple polar analysis, and the outward expansion of the products in the reaction zone is significantly reduced. The velocity decrement and critical dimension (critical diameter or thickness) were determined, and even with different impedance confinement, a 2:1 scaling between the cylinder diameter and slab thickness results was confirmed, in good agreement with curvature-based models of detonation propagation. In the case of weak confinement, the scaling was observed to be slightly less than 2:1. By quantitatively comparison, the results showed the ability of higher impedance confinement to enable the detonation wave to propagate at greater velocity for the same charge thickness. With different impedance confinement and pressure exponent, all the measured shock front curvature and detonation velocity relation agrees with the classic model of Wood and Kirkwood. The computational simulations were compared to a simple, analytic model that treated the interaction of the confinement with the detonation products via Newtonian theory and a model that assumed a continuous variation in shock front curvature with the shock angle at the interface with the confinement matching the angle determined by shock polar analysis. The Newtonian model works well for the case of high impedance confinement, while the shock front curvature model agrees with the simulations for the case of low impedance.
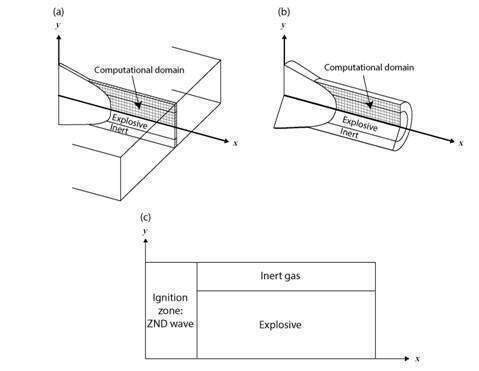
Fig.1 Schematic representation of the problem to be studied showing the computational grid for
(a) two-dimensional slab and (b) axisymmetric geometries, and (c) the initial conditions.
(a) n = 2 (b) n = 3
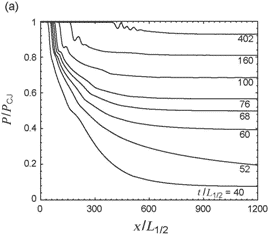
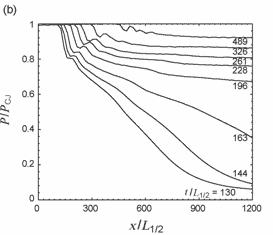
Fig.2 Detonation shock front pressure (normalized by the shock front pressure of an ideal CJ detonation) as a function of propagation distance (normalized by half reaction zone length), showing the decay of the detonation wave from its initial CJ velocity to the steady state terminal velocity. The numerical value of the thickness of the explosive layer (normalized by half reaction zone length) appears next to each curve.
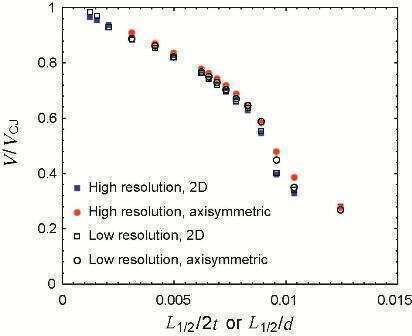
Fig.3 Detonation velocity (normalized by the ideal CJ velocity) for equal impedance confinement and n = 2 as a function of the inverse charge diameter or thickness, normalized by the half reaction zone thickness. The thickness is scaled by a factor of two due to the expected 2:1 scaling of diameter to thickness. Results for two different computational resolutions are shown, corresponding to 5 and 12.5 computational cells per half reaction zone thickness.
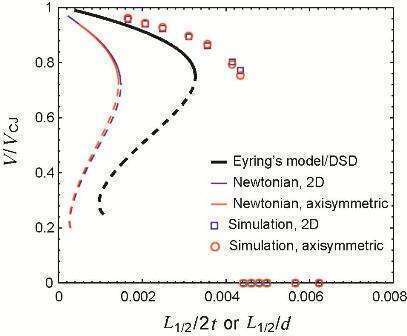
Fig.4 Detonation velocity (normalized by the ideal CJ velocity) as a function of the inverse charge diameter or thickness, normalized by the half reaction zone thickness, and compared to the front curvature model of Eyring et al.22 and the Newtonian model of Tsuge et al.44 for pressure exponent n = 3. The nonphysical branch of the solution past the critical turning point is plotted as a dashed line. Simulations that resulted in detonation wave failure are denoted with symbols along the x-axis.
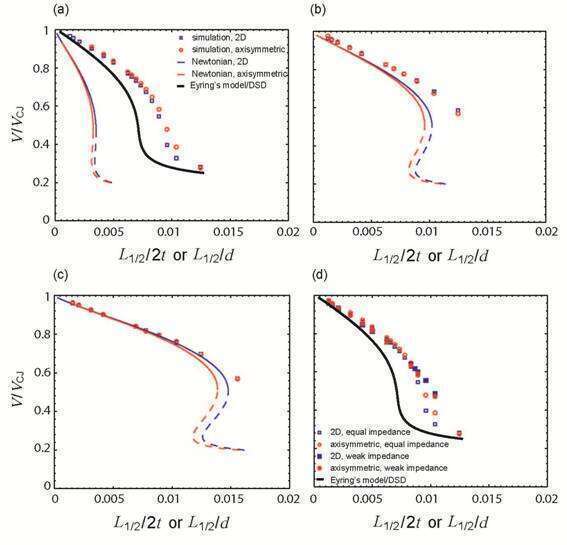
Fig.5 Detonation velocity (normalized by the ideal CJ velocity) as a function of the inverse charge diameter or thickness, normalized by the half reaction zone thickness, and compared to the front curvature model of Eyring et al.22 and the Newtonian model of Tsuge et al.44 for a pressure exponent n = 2 with the density of inert bounding gas equal to (a) , (b) , (c) , and (d) . The nonphysical branch of the solution past the critical turning point is plotted as a dashed line. The Eyring/DSD model is not plotted for the cases where the impedance of the confinement is greater than the explosive.
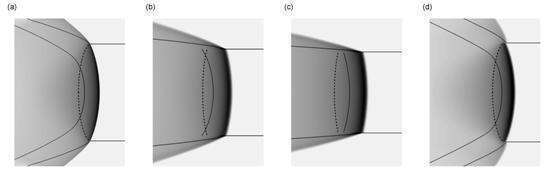
Fig.6 The structure of steady detonation waves obtained in two-dimensional (planar) numerical simulations with pressure exponent n = 2 for the cases of (a) confinement with density equal to explosive (b) confinement with density 5 times the explosive (c) confinement with density 10 times the explosive and (d) confinement with density half that of the explosive. The detonation propagates from left to right. The greyscale shading corresponds to pressure. The initially horizontal contour line is the boundary between the inert confinement and the reacting explosive. The dashed line is the sonic surface relative to the shock front. The contour behind the shock front is the location where the explosive has released 75% of its chemical energy (Z = 0:75). All cases shown correspond to a slab thickness at which the detonation propagates at 75% of the ideal detonation velocity.
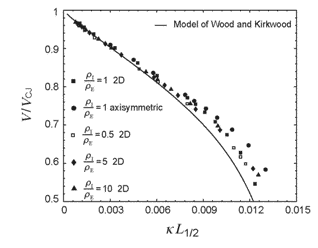
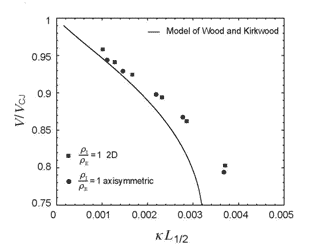
Fig.7 The detonation wave velocity and front curvature measurements from the simulations and the (DN-κ) relation obtained by the model of Wood and Kirkwood15 for (a) n = 2 and (b) n = 3
