Probing Nanographene Phonons with Electron Energy-Loss Spectroscopy
Electron energy-loss spectroscopy (EELS) performed on transmission electron microscopes (TEMs) is widely used for the characterization of optical excitations with atomic resolution [1,2]. The energy of the electrons ~100 keV`s makes it difficult to resolve very low frequency excitations, such as phonons. High-resolution EELS (HREELS) offers an alternative that is capable of resolving molecular adsorption [3] and surface vibrations [4] using less energetic electrons, although this technique lacks spatial resolution below a few nanometers. Recent developments in TEMs have pushed the energy resolution down to ~10 meV [5], thus enabling the study of optical phonons with atomic resolution.
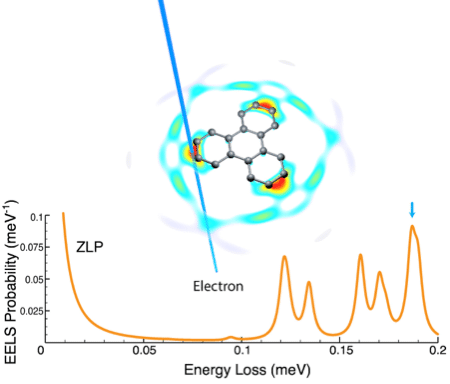
Stimulated by these experimental advances, we theoretically study the high frequency vibrational modes of nanographene structures and extended graphene layers. We discuss both loss spectra and spatially resolved maps for different structures and compare them with the local density of acoustic (or vibrational) states (LDAS), showing how optical phonons can be sampled and studied by means of the new electron microscopes (see Fig. 1). We further discuss the origin of the different features in the spectra, as originating from specific vibrational modes of the structures. The limit of extended graphene is smoothly recovered for large structures. We predict large inelastic signal intensities due to the divergent character of the electron-sample interaction at low frequencies, thus anticipating that phonon losses will produce observable signals down to samples of molecular size.

References
[1] Egerton, R.F., Electron energy-loss spectroscopy in the electron microscope, Springer (1996).
[2] García de Abajo, FJ, Rev. Mod. Phys. 82, 209-275 (2010).
[3] Whang, E.K. et al., Phys. Rev. B 63, 075401 (2001) .
[4] Ibach, H., Mills, D.L., Electron energy-loss spectroscopy and surface vibrations, Academic Press (1982).
[5] Krivanek, O.L., et al, Nature 514, 209-212 (2014).
jose.martinez@icfo.es
Powered by Eventact EMS