
Invited Lecture
How nanoindentation pile up forms revealed by 3D discrete dislocation dynamics simulations
Nanoindentation has become an standard test to probe the local properties of a material such as the yield stress, the Young modulus and eventually the hardening coefficient. The identification of these properties are usually performed following the Oliver & Pharr method [1] who imagined a way to access this data without looking at the surface profile. Although this method is attractive, it is based on assumptions regarding the actual shape of the contact between the indenter and the material at a given applied force. This makes things difficult to exploit when the material is anisotropic like single crystals for which the geometry of the indentation imprint is strongly related to the orientation of the indentation axis.
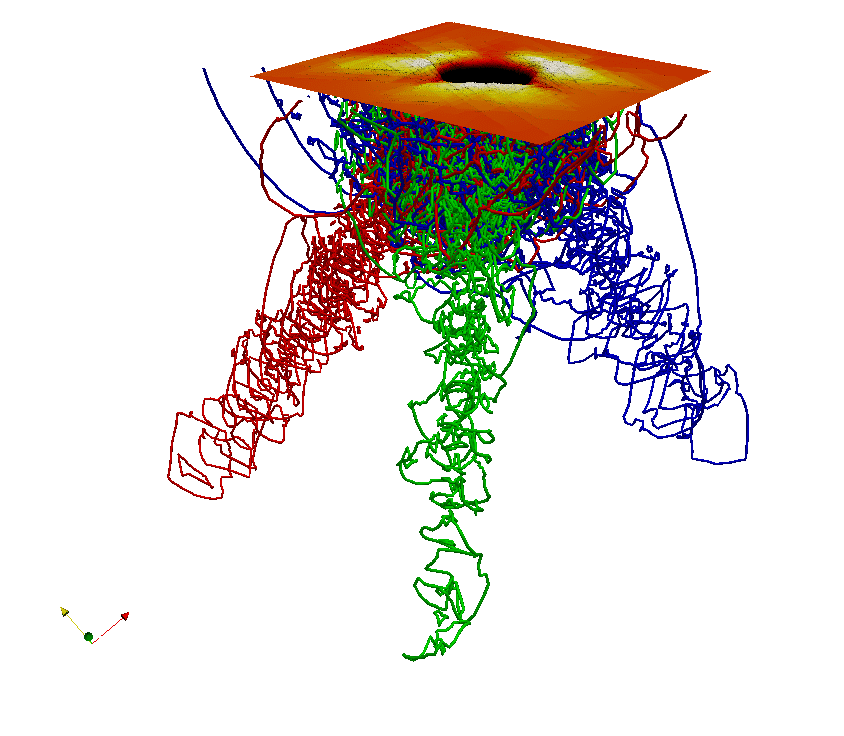
This paper will use 3D Discrete Dislocation Dynamics simulations to explain how pile-ups form during spherical indentation. Following the methofd proposed in [2], DDD simulations of spherical indentation are first performed with several orientations such as (111), (001) and (110). The surface profiles are then compared with experiments performed on pure Copper single crystals. It is found that both the simulated loading curve and the shape of the imprints are in good agreement. For each orientation, the indent-induced dislocation microstructure obtained by DDD is then analyzed in order to understand the origin of the formation of the pile-ups on the surface.
[1] W.C. Oliver and G.M. Pharr, “An improved technique for determining hardness and elastic modulus using load and displacement sensing indentation experiments”, J. Mater. Res. 7(6), pp.1564-1583, (1992).
[2] H.-J. Chang, M. Fivel, D. Rodney and M. Verdier, “Multiscale modelling of indentztion in FCC metals: From atomic to continuum”, C.R. Physique 11, p.285-292 (2010).

Powered by Eventact EMS